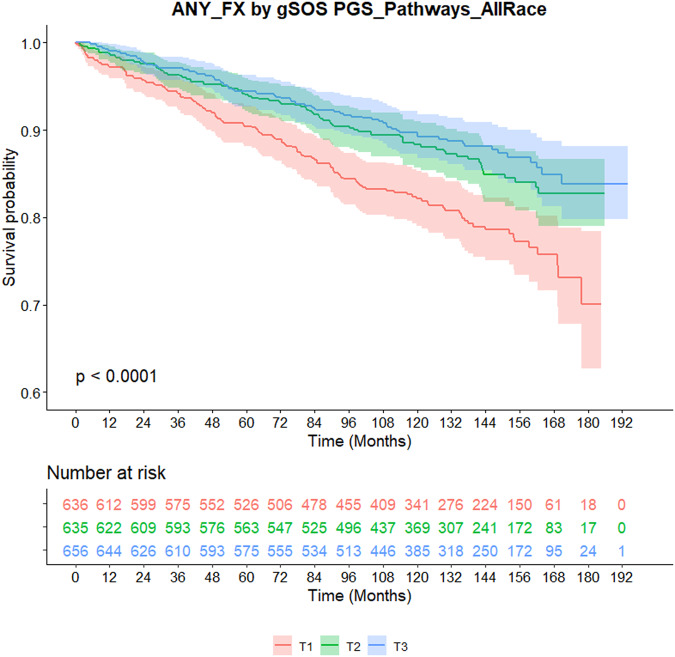
Fig. 1. Kaplan-Meier curves of fracture by the tertile of gSOS in breast cancer patients treated with aromatase inhibitors.
The probability of staying fracture-free from the beginning of follow up is plotted by the tertiles of gSOS, with corresponding 95% confidence interval shown as shades (T1: red; T2: green; T3: blue). The number of patients at risk at set timepoints are shown in the table below the curves. P-value is derived from log-rank test.

