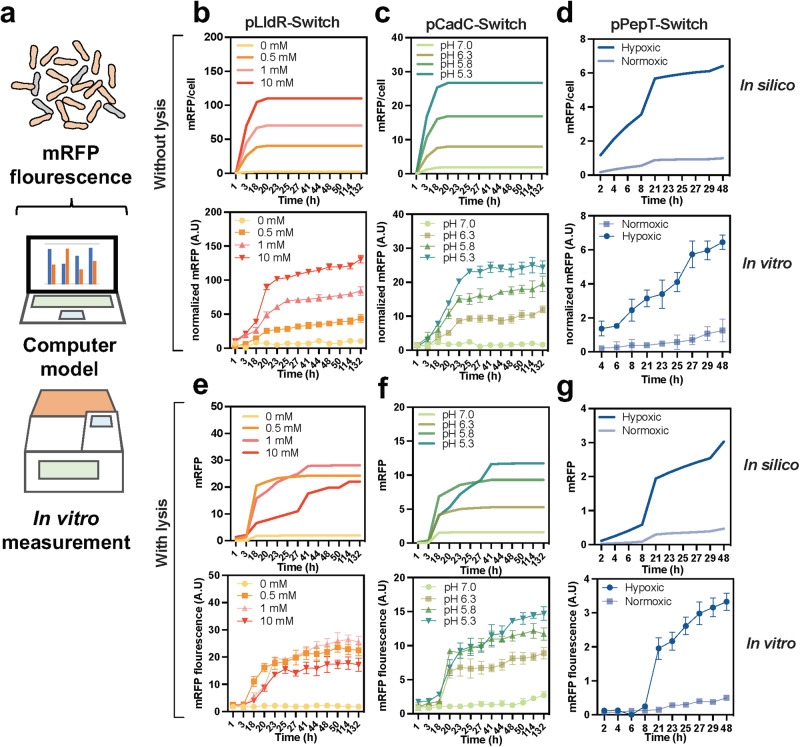
Fig. 2. Computational modelling of biosensor strains.
a Fluorescent changes of biosensor strains under varying environmental signals were measured using microplate reader or predicted in silico modelling. b–d Biosensor strains were modelled (up) under regulation of pLldR (lactate response), pCadC (pH response) and pPepT (hypoxic response) promoters and compared with (down) in vitro experimental results (n = 3, ± s.e.m). The fluorescent results of mRFP were normalized by OD600. e–g In presence of lysis gene, in vitro mRFP fluorescence of biosensor strains were compared with mathematic modeling prediction (n = 3, ± s.e.m). Detailed equations and parameters used in this study could be obtained in supplementary materials.

