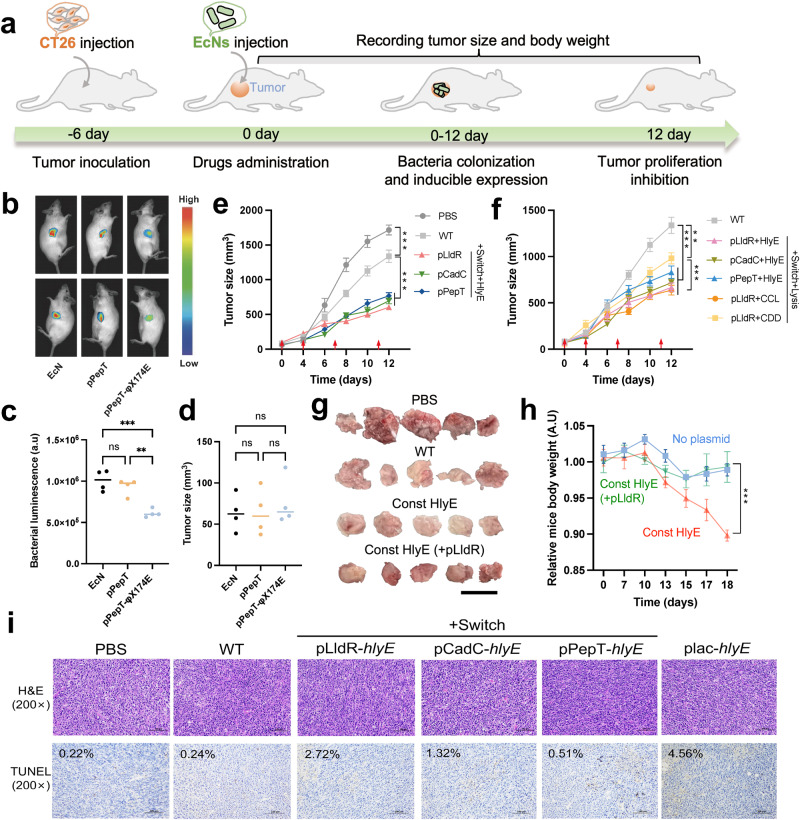
Fig. 4. In vivo therapeutic effect on subcutaneous tumor model.
a Therapeutic schedule of engineered strains administration in a CT26 mouse subcutaneous tumor model. b In vivo imaging of mice with dual hind flank tumors injected with luciferase reporter strains using chemiluminescence imager (Vilber, fx6). c Integrated luminescence density of the luxCDABE reporter strains in a single tumor after injection for 2d was analyzed and calculated using software imageJ 1.53. d Dimension of subcutaneous tumor in mice after injection of luciferase reporter strains (n = 4, ± s.e.m; One-way ANOVA with Tukey post-test; ns: no significant, **p < 0.01, ***p < 0.001). e, f Average tumor volume over time for subcutaneous tumor bearing mice injected with wild-type or engineered EcNs. When average tumor volume reached 150 mm³, the engineered bacterial strain was injected intratumorally on day 0 (start of bacterial therapy), 4, 7 and 11, indicated by red arrows (n = 10 tumors, error bars represent s.e.m; One-way ANOVA with Tukey post-test; **p < 0.01, ***p < 0.001). CCL is an abbreviation for CCL21 and CDD is an abbreviation of fusion protein CDD_iRGD. g Photograph of harvested tumor tissues after different treatments. Scale bar: 2 cm. h Average body weight relative to PBS group for mice bearing subcutaneous tumors injected with the therapeutic strain expressing HlyE under control of pLldR (emerald), strain with constitutively expressing HlyE (orange), or the no-plasmid control strain (sapphire). From the date of tumor cell injection, the engineered strains were injected on day 6, 10, 11 and 15 (n = 5 mice, error bars show s.e.m). i H&E staining and TUNEL staining of the same tumor sections; Scale bars (100 μm) labeled at bottom right of images; TUNEL staining positive rate shown in upper left of images (black). In the TUNEL stained sections, brown represented positive cells. The ratio of TUNEL-positive cells to total cells was analyzed using Aipathwell software. The red box marks the magnified region, highlighting the representative area of positive cells, and is displayed below.

