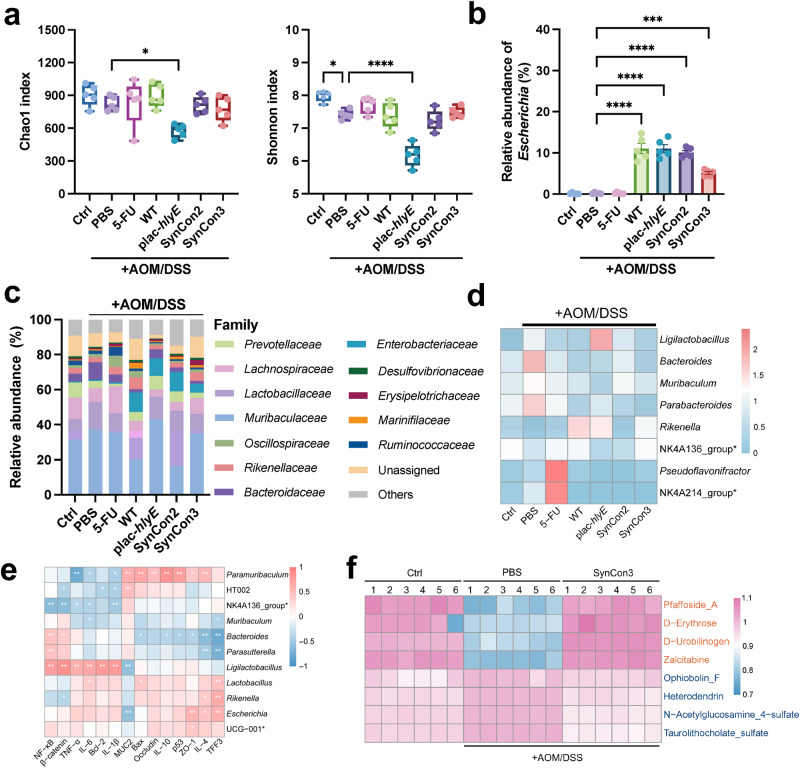
Fig. 6. Gut microbiota and metabolites analyses of AOM/DSS induced CRC mice treated with synthetic bacterial consortium.
a The alterations in alpha diversity indices of gut microbiota were assessed, with species richness and evenness represented by the Chao1 and Shannon indices, respectively (n = 5, ± s.e.m; One-way ANOVA with Tukey post-test; *p < 0.05, **** p < 0.0001). b Relative abundance of Escherichia (n = 5, ± s.e.m; One-way ANOVA with Tukey post-test; ***** p < 0.0001). c Relative abundance of microbial composition at family level. Proportions are the average of five samples. d At the genus level, the heatmap exhibited the differences in gut microbiota observed among the groups. e Spearman’s correlation analysis of microbiota and physiological indexes. Correlations with adjusted p < 0.05 by the Benjamini-Hochberg FDR method are marked with * symbols. f Heatmaps of the differential metabolites between Ctrl, PBS and SynCon3 group. NK4A214_group*: Ruminococcus_NK4A214_group; NK4A136_group*: Lachnospiraceae_NK4A136_group; UCG-001*: Prevotellaceae_UCG_001.

