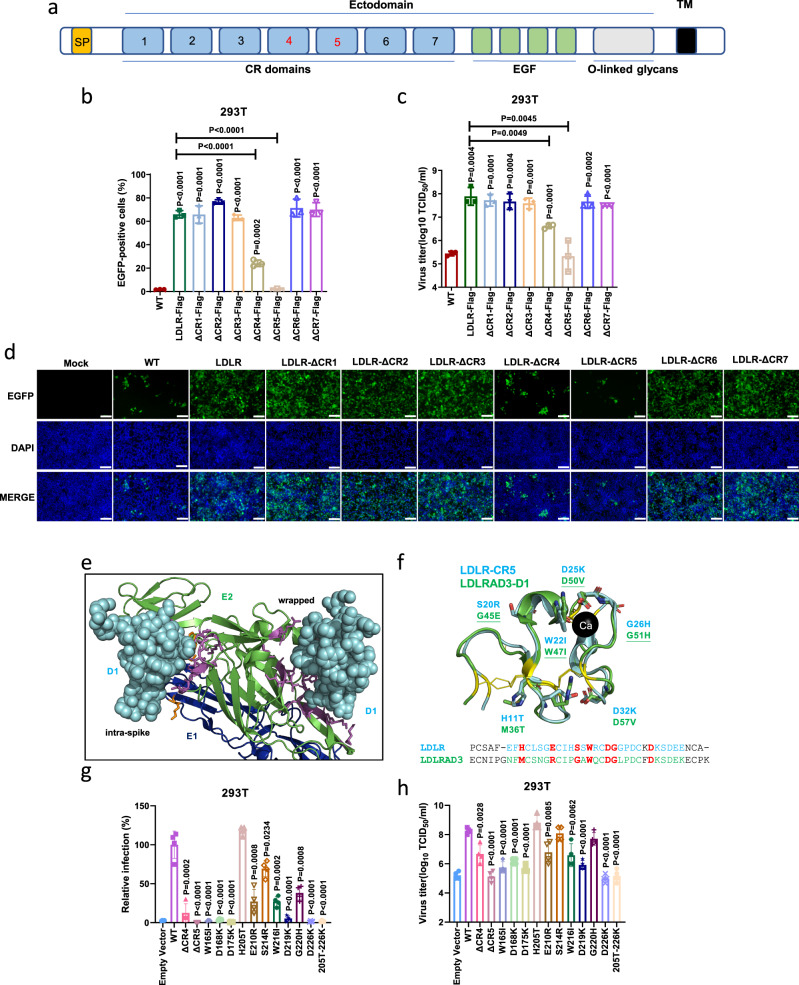
Fig. 6. Identification of domains and amino acid residues important for the functional interaction between LDLR and GETV.
a Scheme of the LDLR protein showing the N-terminal LBD composed of seven CR repeats, a cluster of EGF modules containing a β-propeller domain, and a membrane-proximal O-linked glycans domain. SP: signal peptide; TM: transmembrane region. b–d HEK 293T cells stably expressing pig LDLR or mutants lacking one of CR repeats were infected with rGETV-EGFP (MOI = 1,12 h). EGFP-positive cells were counted by flow cytometry (b) or visualized by fluorescence microscopy (d), and viral titers in supernatants were measured by titration on BHK-21 cells (c). Data are mean ± SD of three biological replicates. Scale bar, 500 μm. e N-terminal part of the E2/ E1 heterodimer of VEEV shown as cartoon (E2 in green, E1 in blue) bound to D1 domain of LDLRAD3 shown as cyan spheres. D1 binds to two different sites, named intraspike and wrapped, respectively. Amino acids in D1 are shown as sticks, magenta for E2 and orange for E1. f Structural alignment of CR5 of LDLR (cyan, PDB: 1AJJ) and D1 of LDLRAD3 (green, PDB: 7N1H, RMSD for alignment = 0.631). The six cysteines forming three disulphide-bonds are colored in yellow. Seven amino acids invoved in D1 binding to E2 of VEEV are shown as green sticks and are underlined if they contribute to the intraspike form. The corresponding residues in CR5 of LDLR are shown as cyan sticks. Ca: calcium ion. The lower part: sequence alignment of D1 and CR5: seven amino acids chosen for mutagenesis in LDLR and the corresponding residues in LDLRAD3 are colored in red. g, h Flow cytometry analysis of rGETV-EGFP (MOI = 1,12 h) infection in HEK 293T cells stably expressing LDLR or mutant LDLR. Results were normalized to cells expressing wt LDLR. Viral titers were measured on BHK-21 cells. Data are mean ± SD of four biologically replicates. Two-tailed P-values are calculated by unpaired Student’s t test, the displayed P-values are the significance between the experimental group and the control group (Control or WT) (b, c, g,h). Source data are provided as a Source Data file.

