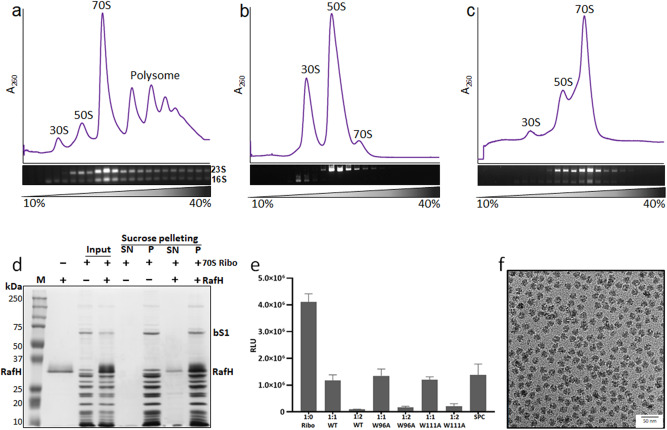
Fig. 1. 70S ribosome RafH complex.
The 10–40% sucrose density gradient fractionation profile and corresponding peaks analysis on agarose gel stained with Ethidium bromide(0.2 μg/ml) are shown for (a) initial ribosome purification, (b) after dissociation and (c) after re-association. The 30S, 50S, and 70S are labeled for ribosomal small subunit, large subunit, and associated ribosome, respectively. The 23S and 16S are labeled for rRNA of 30S and 50S, respectively. We obtained the same results for all (>5) ribosome preparation. d the 70S ribosomes RafH complex formation and sucrose density pelleting, analyzed on 12% SDS-PAGE, with Coomassie blue staining solution, lane 1 - marker, lane 2 - pure RafH protein, lane 3, 4 - input, lane 5 to 8 – SN (supernatant) and P (pellet) fraction after pelleting on a sucrose cushion. The ribo and bS1 are labeled for ribosome and bacterial ribosomal protein bS1, respectively. e In-vitro protein synthesis assay by titrating ribosome and wild type (WT) RafH, W96A RafH mutant, W111A RafH mutant or antibiotic spectinomycin (SPC) at different stoichiometric ratios of 1:1 or 1:2. The RLU (Relative Luminescence Unit) is measured as the production rate of nLuc activity. Data represents as mean ± SEM (standard error mean), where n = 3. f The 2D cryo- EM micrograph collected during the initial grid screening stage in a JEOL 2200 FS microscope with a Gatan K2 Summit camera. The source data for Fig. 1 is provided in the source data file.

