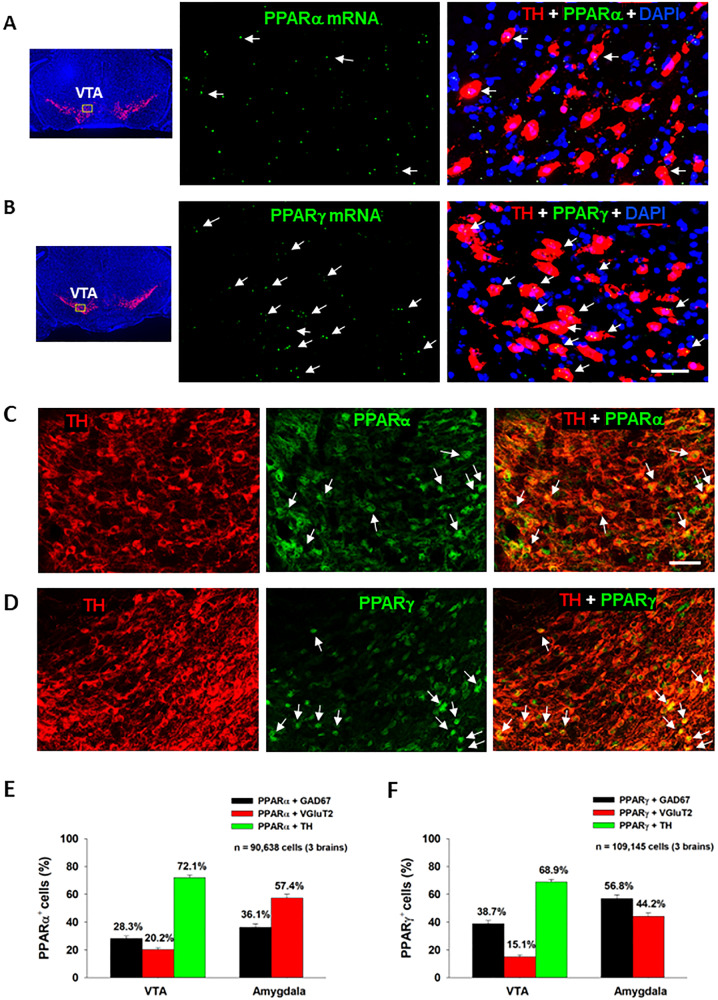
Fig. 1. PPARα and PPARγ RNAscope ISH and immunostaining results.
A/B Representative RNAscope ISH, illustrating low densities of PPARα (A) and PPARγ (B) mRNA signals detected in TH+ DA neurons in the VTA. C/D Representative images indicating that PPARα- or PPARγ-immunostaining was co-localized with TH-immunostaining in VTA DA neurons. E/F The cell counting data indicate that PPARα and PPARγ are expressed in ~70% of DA neurons in the VTA and in 40–60% of GABA or glutamate neurons in the Amygdala. The scale bar indicates 50 μm. Each bar illustrates the average percentage of cells co-expressing PPARα or PPARγ with one neuronal marker (TH, GAD67 or VGluT2) out of the total number of DA, glutamate or GABA neurons. N = 3 brains with 5–6 slices selected from each brain and 2–4 images taken per region/slice. (see Figs. S1–S6 for PPARα or PPARγ mRNA or immunostaining in other types of neurons in the VTA, NAc and amygdala).

