Fig. 2.

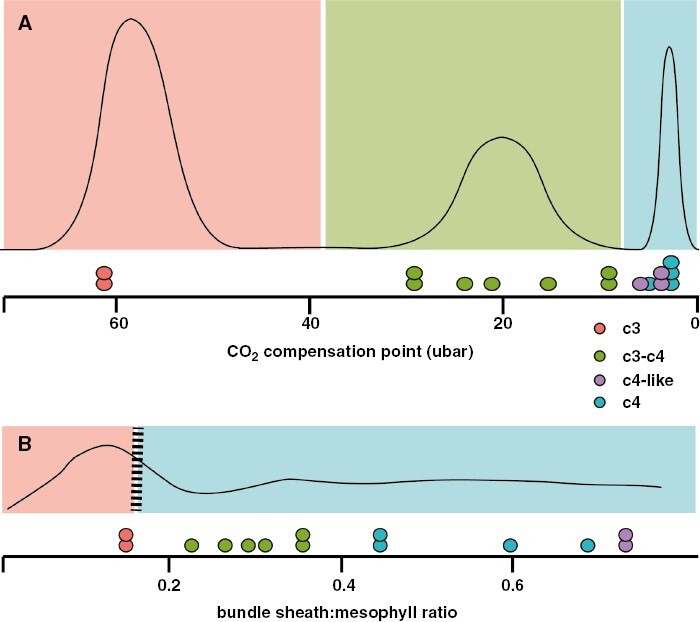
Discretizing quantitative characters to delineate stages of an evolutionary trajectory. (A) Hypothetical distribution of trait values for a character that is naturally multi-modal. In this case, it is straightforward to bin the standing variation into ‘low’, ‘medium’ and ‘high’ values. Dots below the hypothetical distribution curve are real data from Flaveria for the CO2 compensation point, demonstrating a clear phenotypic gap between C3 and C3–C4 species, less so between C3–C4 and C4. (B) Discretization can also be justified when the distribution is not multi-modal, perhaps with other analyses that support threshold values where a particular value of one trait influences the evolvability of another. In this case, the bundle sheath-to-mesophyll (BS:M) ratio of leaves might show a relatively flat distribution, but phylogenetic modelling studies demonstrate that a BS:M ratio of 0.15 is required for C4 evolution (although the BS:M ratio of many C4 plants is much higher than that number). Dots below the hypothetical distribution curve are real data from Flaveria for the BS:M ratio, demonstrating no clear phenotypic gaps, but the C3 species lie right at the value of the modelled threshold, with all other C3–C4 and C4 species on the other ‘C4 side’ of the threshold. We may use thresholds to discretize traits into ‘low’ and ‘high’ bins that are biologically relevant. Flaveria data are from Lyu et al. (2021).
