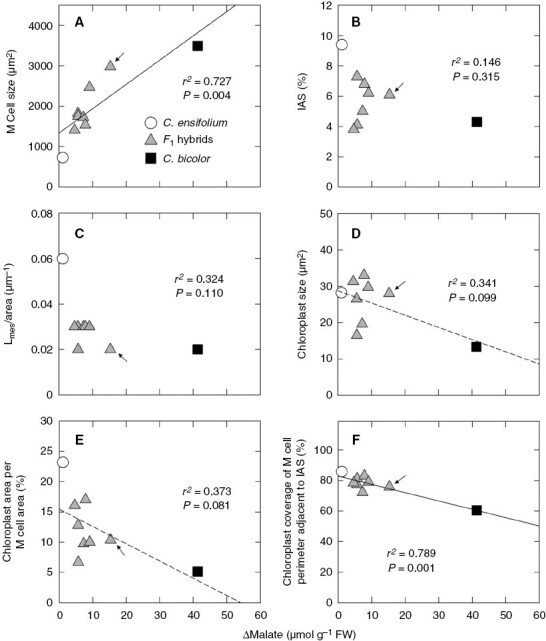
Fig. 5.

Relationships between Δmalate and (A) mesophyll cell size, (B) proportion of IAS, (C) Lmes/area, (D) chloroplast size, (E) chloroplast area per mesophyll cell area and (F) chloroplast coverage of cell perimeter adjacent to IAS in leaves of C. ensifolium, C. bicolor subsp. pubescens and their F1 hybrids. M, mesophyll. Arrows show values of hybrid 3. Regression lines with non-significant P values (0.05 < P < 0.1) are shown by dashed lines.
