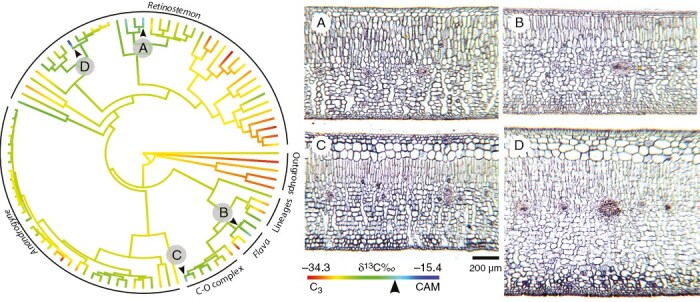
Fig. 3.

Ancestral state reconstruction of δ13C values on a maximum likelihood phylogenetic tree. Arrowheads indicate δ13C less negative than −20 ‰. (A–D) Transverse sections of leaves of plants with strong CAM. (A) Clusia uvitana. (B) Clusia lundellii. (C) Clusia rosea. (D) Clusia firmifolia Cuatrec. Modified from Luján et al. (2022).
