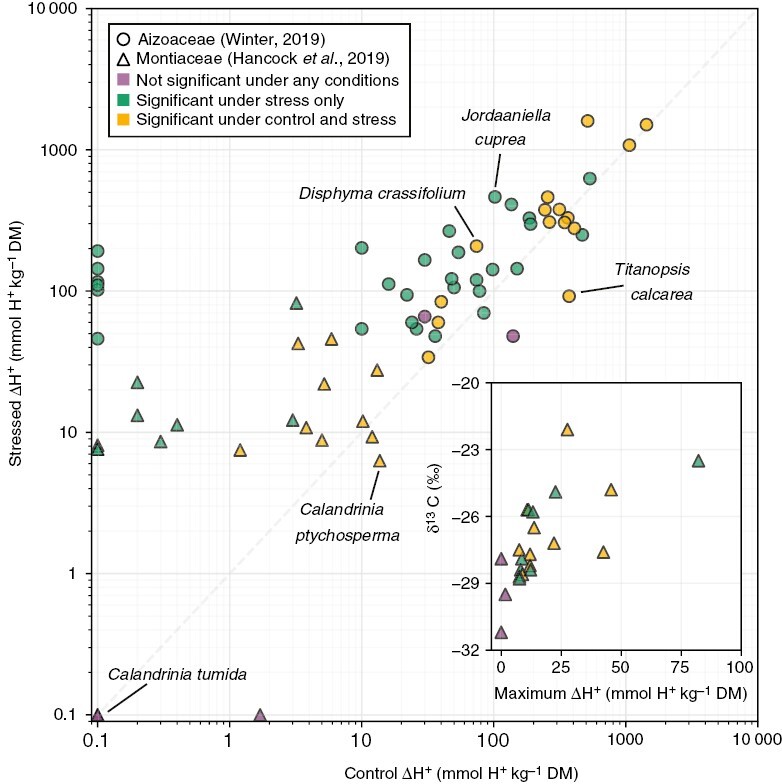
Fig. 3.

Mean diel ΔH+ in control (well-watered) and stress (drought or drought + salt stress) conditions of 45 Aizoaceae species (circles) (Winter, 2019) and 22 Montiaceae species (triangles) (Hancock et al., 2019). Purple points represent species with no significant ΔH+ in any conditions. Green points represent species with significant ΔH+ only in stress conditions. Yellow points represent species with significant ΔH+ in both control and stress conditions. The inset shows the maximum ΔH+ and mean δ13C values (Hancock et al., 2019) of the same Montiaceae species in the main plot. Note that ΔH+ for Aizoaceae species was calculated by multiplying changes in tissue malate concentrations given by Winter (2019) by a factor of two, assuming that 1 mol malate corresponds to 2 mol H+. Points with ΔH+ < 0.1 were plotted at 0.1 for visualization. Five individual species discussed in the main text are labelled.
