
Figure 1.
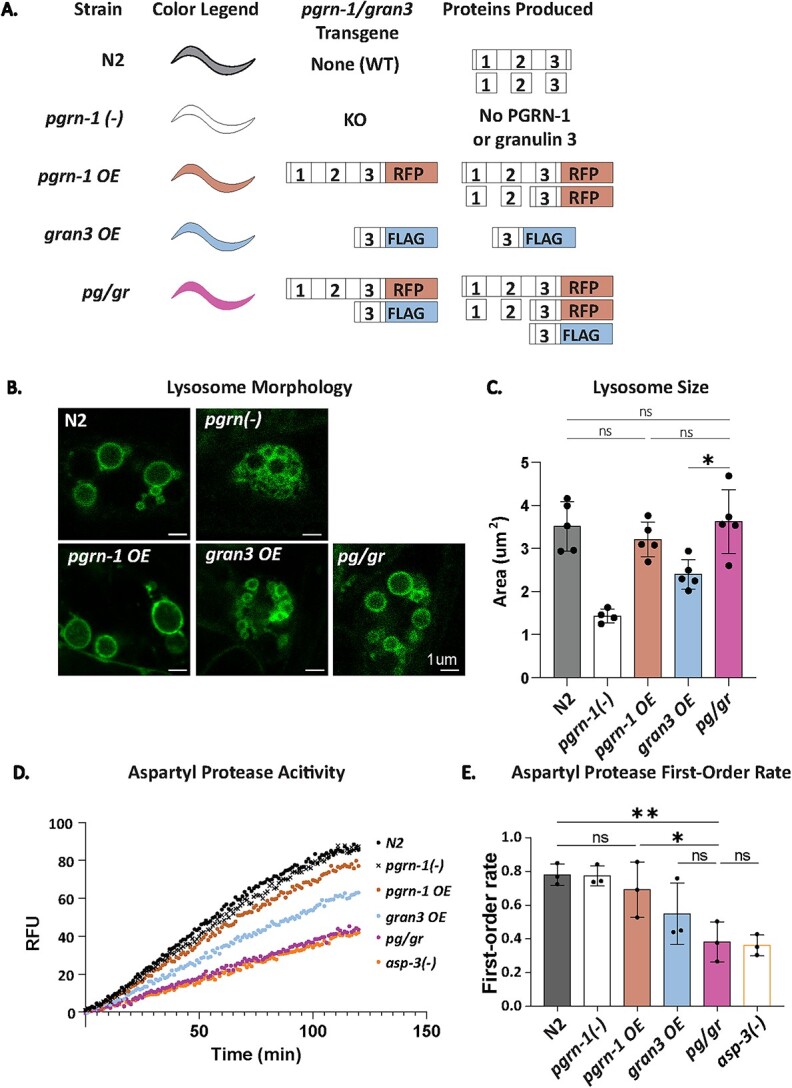
Full-length PGRN-1 rescues granulin 3-induced abnormal lysosome morphology but not aspartyl protease activity. (A) Schematic of the lines used. The color legend refers to the colors used throughout the figs. (B) Representative images of LMP-1::GFP-tagged coelomocyte lysosomes, imaged by confocal microscopy. (C) Lysosomal area was quantified for each strain by tracing the perimeter of lysosomes. n = 8 animals, 5 biological replicates. (D) Representative aspartyl protease activity traces. Data was collected by a plate reader using a fluorescence substrate mixed with worm lysate. n = 3 biological replicates of day 1 animals. (E) First-order rate of protease enzyme activity as calculated from (D). Error bars represent mean +/− SEM comparisons with one-way ANOVA with post hoc Sidak comparisons (*P < 0.05, **P < 0.005, ns = not significant).