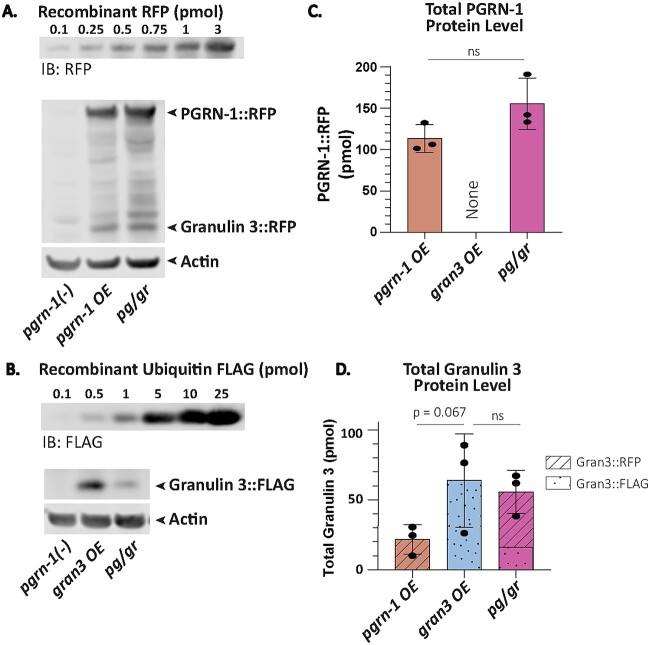
Figure 2.
Quantification of PGRN-1 and granulin 3 levels. Day 1 animals were collected for Western blot. (A) A representative blot of the recombinant RFP standard curve, the RFP tagged PGRN-1 protein and RFP-tagged granulin 3 peptide from pgrn-1 OE and pg/gr animals’ whole worm lysate immunoblotted with an anti-RFP antibody, and the corresponding actin immunoblotted with an anti-actin antibody. (B) A representative blot of the standard curve of recombinant ubiquitin tagged FLAG and the FLAG-tagged granulin 3 peptide levels in gran3 OE and pg/gr animals’ whole worm lysate immunoblotted with an anti-FLAG antibody, and the corresponding actin immunoblotted with an anti-actin antibody. (C) Total PGRN-1::RFP as calculated using the standard curve in (A), normalized to actin. n = 3 biological replicates. Statistics done by student t-test. (D) Total granulin 3 amounts as calculated using the standard curves in (A) and (B) and normalized to actin. n = 3 biological replicates. Statistics done by one-way ANOVA with post-hoc Sidak comparisons as indicated. (*P < 0.05, ns = not significant).

