FIGURE 3.

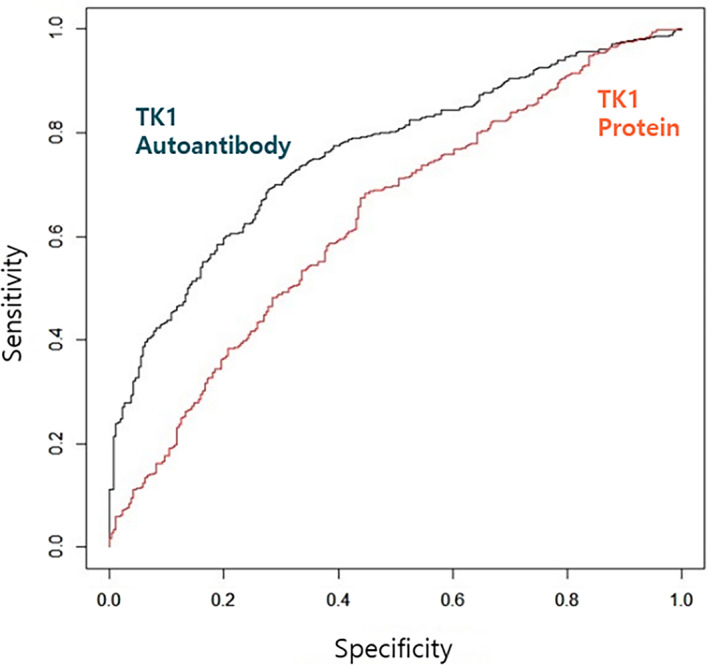
ROC curve of TK1 protein OD and TK1 autoantibody ratio. In the ROC curve of TK1 protein, AUC was 0.633 (P < .001, 95% CI [0.592‐0.675]), and the AUC of TK1 autoantibody ratio was 0.758 (P < .001, 95% CI [0.723‐0.793]).

ROC curve of TK1 protein OD and TK1 autoantibody ratio. In the ROC curve of TK1 protein, AUC was 0.633 (P < .001, 95% CI [0.592‐0.675]), and the AUC of TK1 autoantibody ratio was 0.758 (P < .001, 95% CI [0.723‐0.793]).