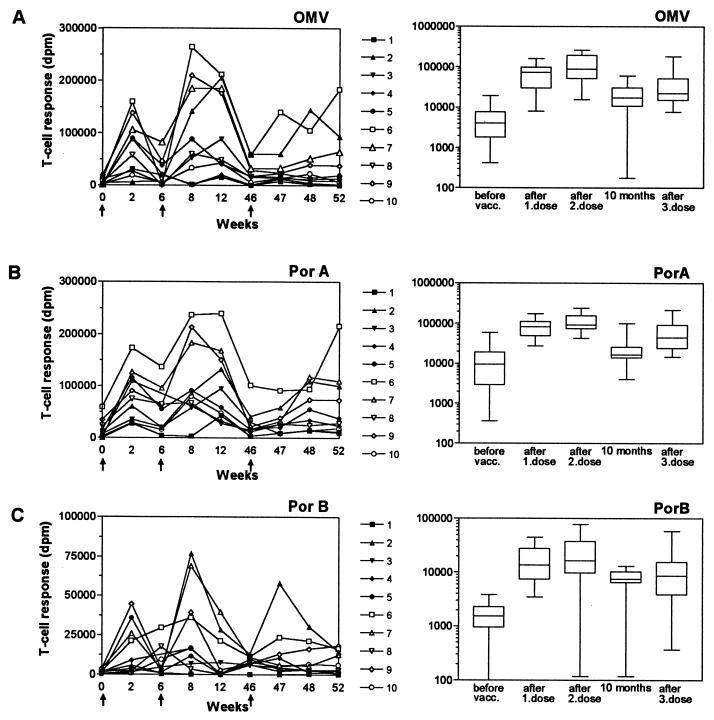
FIG. 1.
T-cell responses in 10 adult vaccinees receiving three doses of OMV vaccine measured as in vitro proliferative responses in disintegrations per minute after 6 days of stimulation with vaccine antigens: OMV vaccine (A), purified PorA outer membrane protein (B), and purified PorB outer membrane protein (C). Left panels show responses for individual vaccinees, and immunizations are indicated by arrows. Right panels show maximum T-cell responses obtained before vaccination, after the first and second dose, 10 months after the first dose, and after the third dose given. Boxes extend from the 25th to the 75th percentile, with a horizontal line at the median. Vertical bars show the range of the data. Significant responses after vaccination were observed after each immunization (OMV, P = 0.002; PorA, P = 0.002; and PorB, P = 0.002 after the first dose and P = 0.0039 after the second and third doses).

