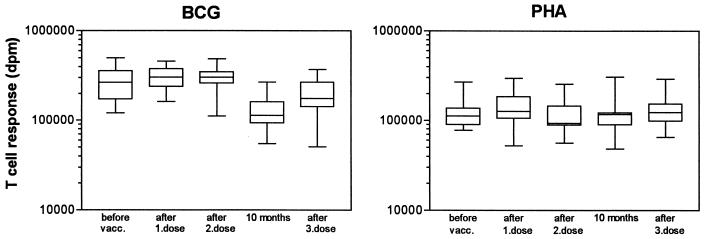
FIG. 2.
T-cell responses against control antigens in the OMV-vaccinated individuals after 6 days of stimulation with BCG vaccine and PHA. Maximum responses (in disintegrations per minute) obtained before vaccination, after the first and second doses, 10 months after the first dose, and after the third dose are shown. Boxes extend from the 25th to the 75th percentile, with a horizontal line at the median. Vertical bars show the range of the data.

