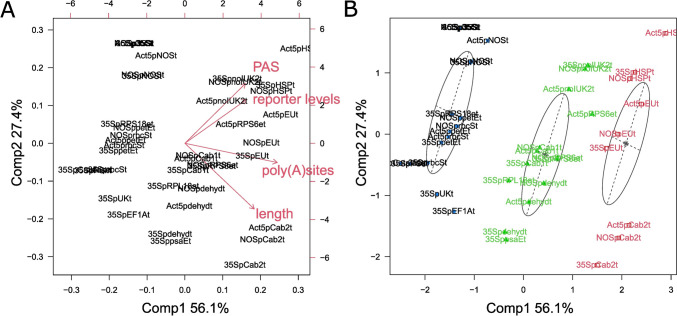
Fig. 6.
Principal component analysis of reporter levels and terminator attributes. A PCA was calculated for the reporter levels obtained, the number of PAS, the number of poly(A) sites, and terminator lengths. Reporter levels of the single promoter series (PpActin5p, 35Sp, NOSp) were normalized to the respective promoter combined with the 35S terminator to remove promoter effects from the dataset. The biplot in A shows the different loading vectors of reporter levels and terminator attributes. The PCA plot in B shows the result of the model-based clustering using Mclust (Fraley and Raferty 2003). Reporter levels correlate with the number of PAS whereas the number of poly(A) sites and terminator length determine cluster formation. Promoter–terminator combinations are sorted into three clusters in black, green, and red. The scores for each datapoint can be found in Supplementary table S8

