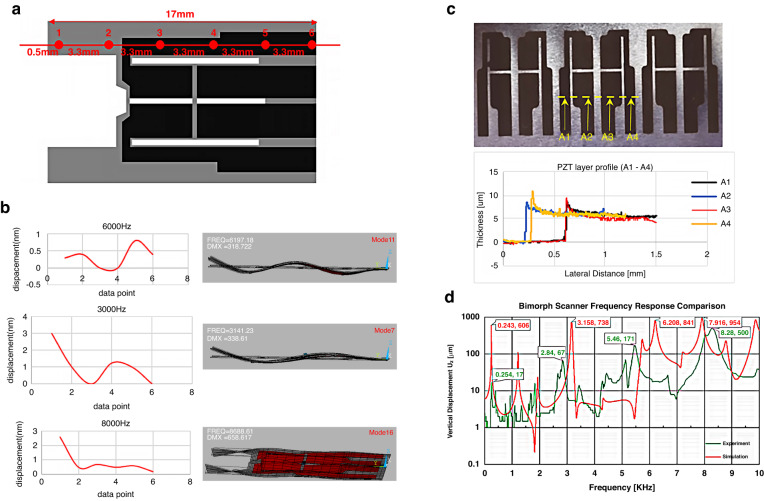
Fig. 3. Actuator profile measurement, responsivity, and frequency response.
a Diagram of measurement sites recorded by laser Doppler vibrometer. b (Left) Reconstruction of the actuator vibration obtained from laser vibrometer measurements at the points in a. (Right) The mode shapes generated from the ANSYS simulation, showing agreement between simulation and measurement. c PZT thin film thickness measured using a profilometer at sites A1–A4. d Comparison of vertical displacement (Uz) between simulation and experimental results

