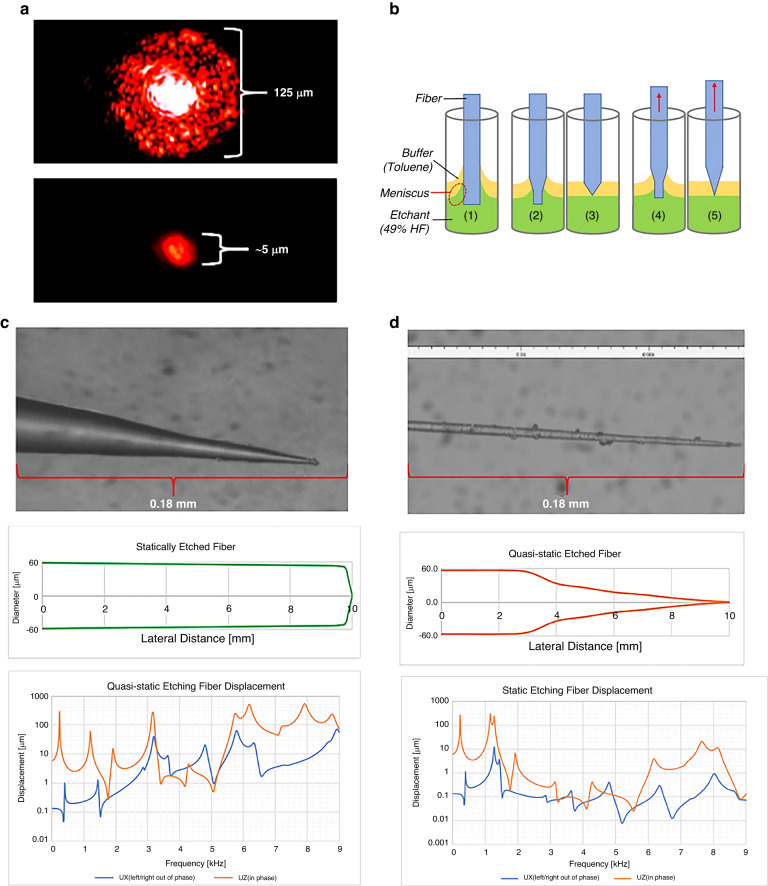
Fig. 4. Fiber tapering process and results for static and quasistatic tip etching.
a Comparison of fiber light transmission before (top) and after tapering. b Diagram of static and quasistatic etching process: (1) unetched fiber and legend, (2–3) static etching process, (4–5) quasistatic etching process depicting motion of fiber. c Image of the statically etched fiber tip, approximate profile, and frequency response of fiber displacement in the X & Z directions (air damping = 0.0115). d Image of quasistatically etched fiber, approximate profile, and frequency response of fiber displacement in the X & Z directions (air damping = 0.0115)

