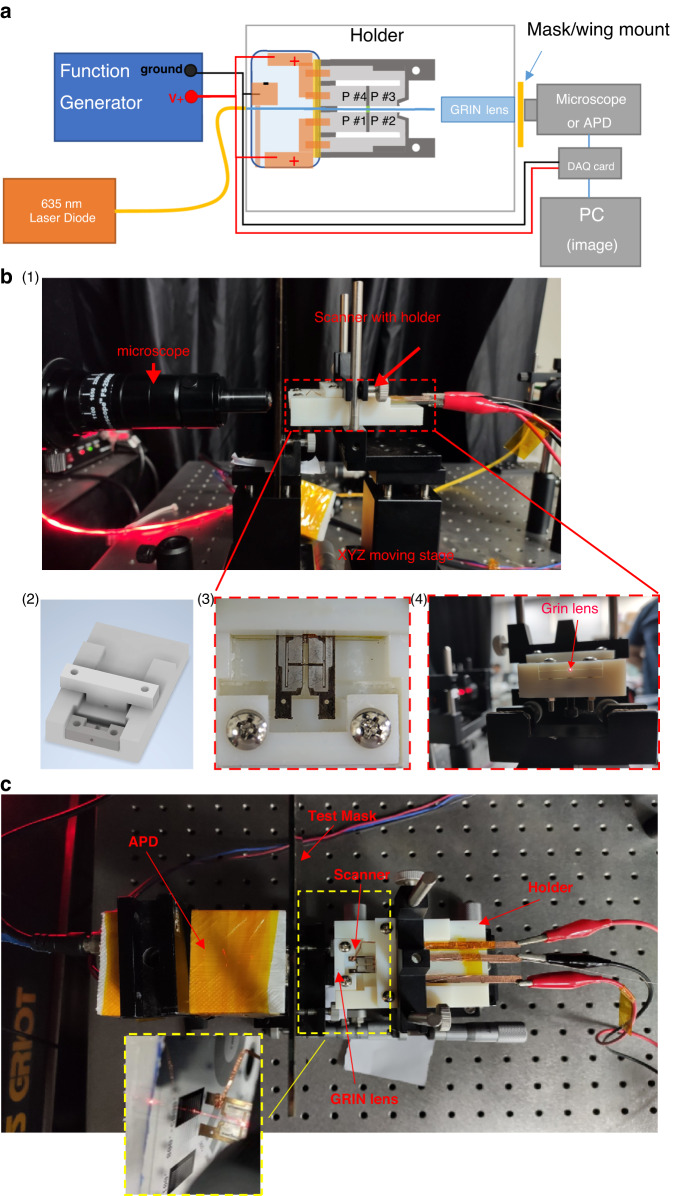
Fig. 5. Scanner experiment setup for illumination and control tests.
a Diagram of the image acquisition experiment setup. The scanner and GRIN lens are secured by a holder mounted to an XYZ moving stage to ensure alignment for both the microscope and APD image acquisition. The DAQ card is only used with APD measurements. The frequency response tests had the microscope directly observe the scanner fiber tip. b (1) Side view of the frequency response experiment setup showing mounting of the holder on the XYZ stage. (2) Holder design, (3) scanner secured in holder, (4) light output of GRIN lens secured by the holder. c Image acquisition test setup for the pass-through configuration. The yellow dotted window shows the top view of the device emitting light toward the test pattern on the chrome mask

