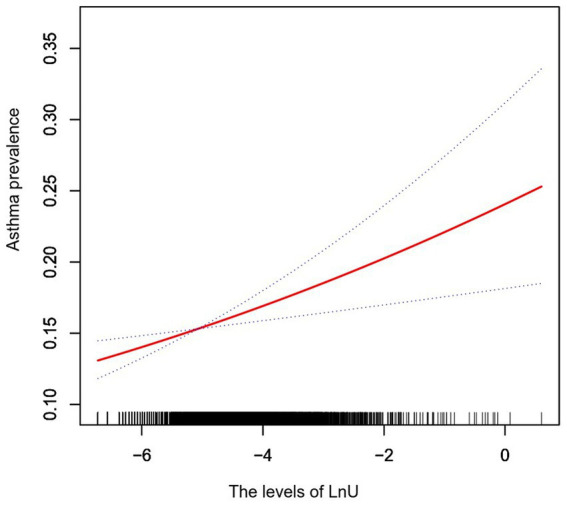
Figure 1.

Smoothed curve fitting shows the association between urine LnU and asthma prevalence after adjusting for confounders (age, gender, race, BMI, education, marital status, PIR, diabetes, hypertension, alcohol use, BUN, TB, TP, globulin, LnBa, LnCd, LnCo, LnCs, LnPb, LnSb, LnTl, LnTu, and LnHg). The area between the two dashed lines indicates a 95% confidence interval. U, uranium; BMI, body mass index; PIR, poverty to income ratio; BUN, blood urea nitrogen; TB, total bilirubin; TP, total protein; Ba, barium; Cd, cadmium; Co, cobalt; Cs, cesium; Pb, lead; Sb, stibium; Tl, thallium; Tu, tungsten; Hg, mercury.
