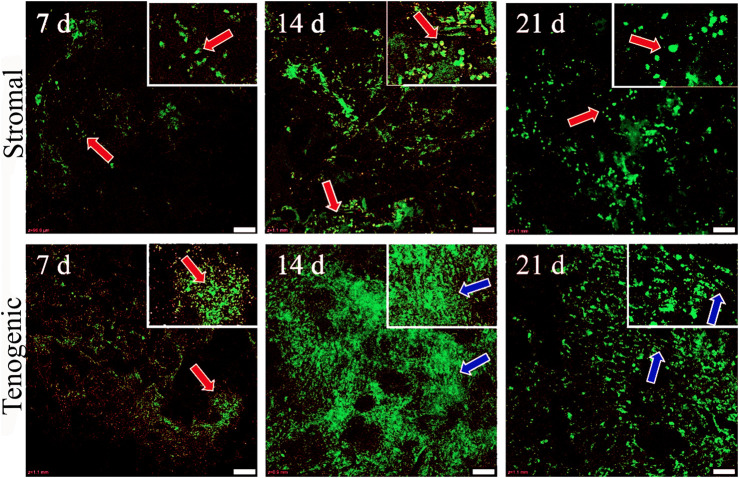
FIGURE 5.
Viable cell distribution in COLI-ASC constructs. Photomicrographs of constructs cultured in stromal (upper) or tenogenic (lower) medium for 7, 14, or 21 days with green viable and red nonviable cells shown. Cells with spherical (orange arrows) and elongated (blue arrows) morphology are indicated. Insets at the top right corners are enlargements of areas around the arrows in the larger images. Scale bars = 100 μm.

