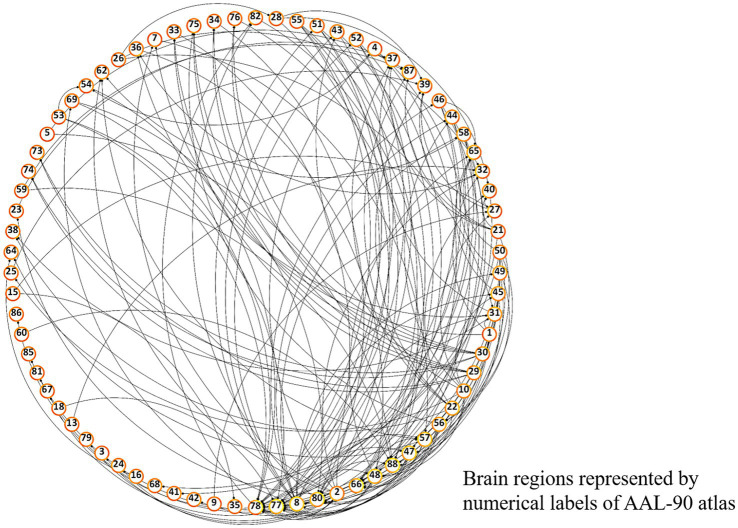
Figure 3.
Overall FC dysfunction in schizophrenia patients. Visualized plot of significantly different pairwise functional connectivities between schizophrenia and control groups among AAL-90 brain regions. Brain regions are presented in a clockwise arrangement according to the number of interconnections, and are represented by numerical label of the AAL-90 atlas (Supplementary Table S1).

