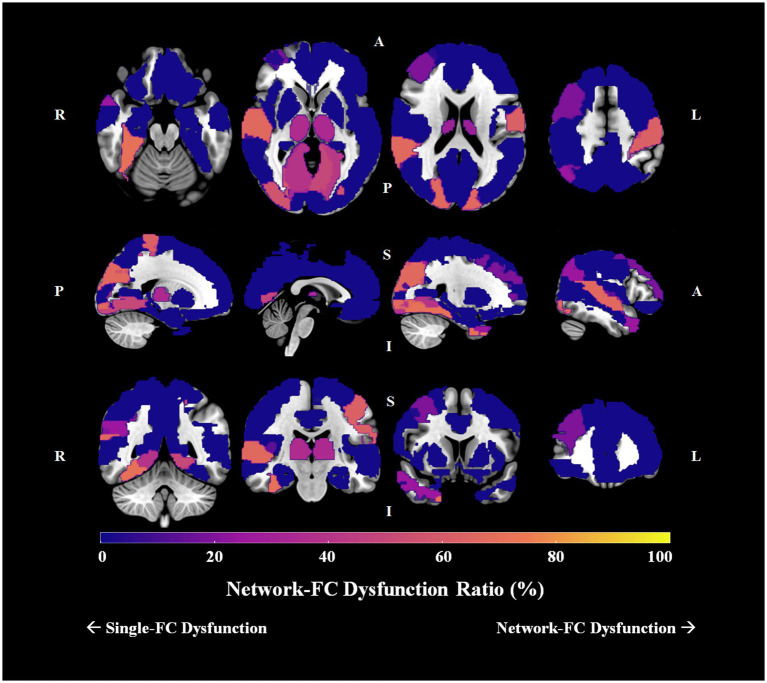
Figure 5.
Network-FC dysfunction ratio among 90 brain regions in schizophrenia. The single-FC or network-FC dysfunction ratio for a given brain region is a comparative concept. Hot regions (bright yellow) in the figure represent areas with higher network-FC dysfunction ratio and lower single-FC dysfunction ratio; whereas cold regions (dark purple) represent areas with lower network-FC dysfunction ratio but higher single-FC dysfunction ratio. (Orientation of brain slices: L, left, R, right, A, anterior, P, posterior, S, superior, I, inferior).

