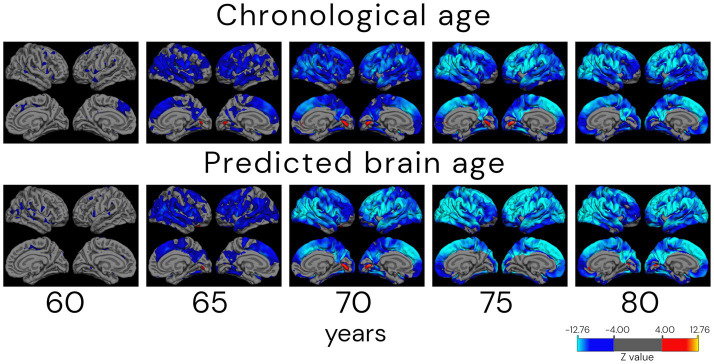
Figure 11.
Atrophy patterns in ageing according to chronological and predicted brain age in the cross-validation approach (CNN2). Analysis shows cortical thickness z-stat maps corrected for false discovery rate with a threshold of 0.05 of cross-sectional differences between a reference group of 55 (±1.0) years old and older subjects. Individuals were grouped by age ± 1.0 years. The QDEC analyses were done with a 10 mm smoothing kernel and sex added as a covariate. Blue colours represent lower cortical thickness (increased atrophy) in the age group compared to the 55-year-old group, and red colours represent an increased cortical thickness compared to the younger group. It is possible to verify that the atrophy patterns start in parietal–frontal regions in the 65-year-old group. The approach also captures the increased thickness (in red) around the lingual gyrus.

