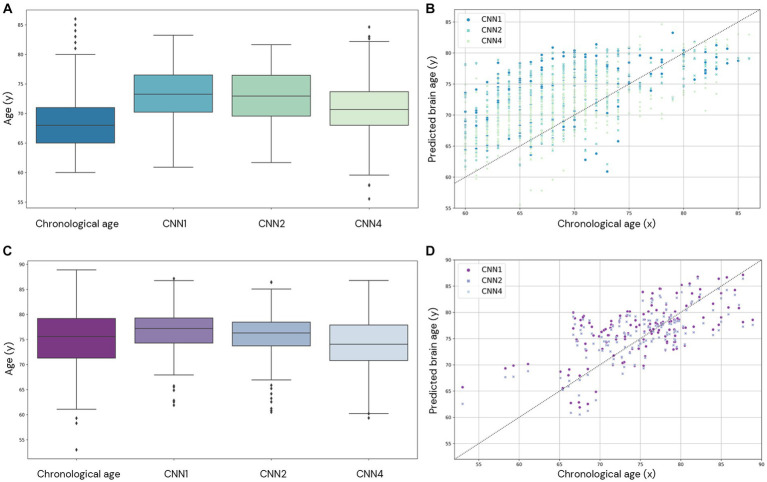
Figure 7.
Comparison of brain age prediction distribution for chronological and predicted brain age in CNN1, 2, and 4 for the AddNeuroMed (A,B) and J-ADNI (C,D) cohorts. In (A,C), we present the boxplot of the predicted brain age for each model compared to the chronological age. In (B,D), the predicted brain age distribution is compared to the chronological age.

