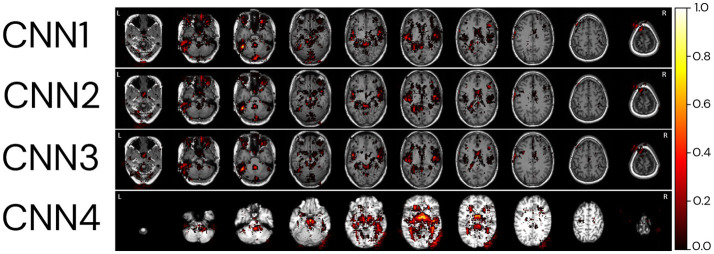
Figure 9.
Relevant regions for age prediction. The absolute values of the salience maps for each model were averaged through the whole MRI sample and normalized between 0 and 1 for better visualisation. The SmoothGrad method was used to generate all salience maps. Overlayed salience map colours are normalized for each individual between 0 and 1.

