

Abstract
Background and Purpose:
Very preterm infants (VPIs, <32 weeks gestational age at birth) are prone to long-term neurological deficits. While effects of birth weight and postnatal growth on VPIs’ neurological outcome is well established, the neurobiological mechanism behind these associations remains elusive. In this study, we utilized diffusion tensor imaging (DTI) to characterize how birth weight and postnatal weight gain influence VPIs’ white matter (WM) maturation.
Methods:
We included VPIs with complete birth and postnatal weight data in their health record, and DTI scan as part of their pre-discharge MRI. We conducted voxel-wise general linear model and tract-based regression analyses to explore the impact of birth weight and postnatal weight gain on WM maturation.
Results:
We included 91 VPIs in our analysis. After controlling for gestational age at birth and time between birth and scan, higher birth weight Z-scores were associated with DTI markers of more mature WM tracts, most prominently in the corpus callosum and sagittal striatum. The postnatal weight Z-score changes over the first 4 weeks of life were also associated with increased maturity in these WM tracts, when controlling for gestational age at birth, birth weight Z-score, and time between birth and scan.
Conclusions:
In VPIs, birth weight and post-natal weight gain are associated with markers of brain WM maturation, particularly in corpus callosum, which can be captured on discharge MRI. These neuroimaging metrics can serve as potential biomarkers for early effects of nutritional interventions on VPIs’ brain development.
Keywords: Diffusion imaging, preterm infants, white matter maturation
INTRODUCTION
Very preterm births (<32 weeks gestational age) occur in up to 1.6% of live births annually, with these neonates representing about half of infant deaths yearly.1,2 Despite improvements in the medical care available to preterm neonates, many very preterm infants (VPIs) suffer from long-term neurological deficits. Up to a third of VPIs experience cognitive or language delays by school age with about 30% experiencing delays in multiple functional domains.3 Additionally, psychiatric conditions occur in up to 25% of VPIs and are three times more likely to develop in VPIs when compared to children born at term (≥37 weeks gestational age.4 Debilitating neurological disorders such as cerebral palsy are also more prevalent in VPIs than term neonates, occurring in up to 20% of very preterm and extremely preterm (<28 weeks) infants.5 Since long-term adverse outcomes are observed far past the neonatal period, there is an unmet need for early markers of neurodevelopment to assess the effects of peri-natal risk factors and postnatal interventions in observational studies and clinical trials.
In addition to gestational age at birth itself, the growth of VPIs in the postnatal period has also been linked to the severity of neurodevelopmental deficits.6,7 The positive effect of increasing weight gain in the postnatal period on the long-term cognitive outcomes of VPIs has been well described.6,7 Likewise, growth failure in the postnatal period is linked to worse long-term cognitive outcomes in VPIs.8,9 Similar findings have been described for the incidence of cerebral palsy and poor psychomotor development in VPIs,10 placing postnatal growth as a modifiable risk factor for neurodevelopmental outcomes in this vulnerable population. With this in mind, multiple studies have described how nutritional intake in the postnatal period influences neurological outcomes in the first few years of life.11,12 However, translation of this knowledge to effective nutritional intervention guidelines for improving long-term outcomes in VPIs is still an area of active research. Given the limitation of neurological examination in neonates, imaging markers that can identify early neurodevelopmental changes in response to postnatal growth can facilitate nutritional interventions by providing early indicators of future neurocognitive outcomes.
Routine structural brain MRI can only identify most severe forms of structural abnormality or obvious parenchymal injury in neonates; moreover, diffusion tensor imaging (DTI) can provide quantitative information by characterizing white matter (WM) microstructural integrity in the brain.13 Prior studies have utilized DTI scans obtained in the early postnatal period to characterize WM microstructural development in neonates of varying gestational age.14 Such works have also identified specific WM regions that experience microstructural delay in neonates born at lower gestational age, suggesting that DTI can serve as a marker for neurodevelopment for VPIs.15 Furthermore, as clinical neurological examination and prognostication of long term neurodevelopmental outcome using early clinical evaluations in neonates are challenging, neuroimaging performed in the early postnatal period can fill these gaps by providing insight into early brain maturation.16,17 In this study, we utilized term-equivalent DTI to characterize how birth weight and postnatal growth might influence WM microstructure in VPIs.
METHODS
Subjects
We retrospectively reviewed the imaging and electronic health records of all neonates born between January 2013 and March 2021 at our institution who had brain MRI scans within the first 3 months of life for this analysis. Brain MRI is regularly performed for preterm neonates around term-equivalent gestational age at our institution. We included neonates who (1) were born very preterm (<32 weeks gestational age at birth), (2) underwent DTI as part of their pre-discharge MRI, (3) had DTI series without excessive artifact or distortion, and (4) had adequate electronic health record information to obtain weight measurements at birth and postnatal period. We excluded any infants who had structural abnormalities or image artifacts on their scans or neurological deficits noted in their electronic health record during the hospital stay. As preterm neonates at our institution are weighed weekly, we collected the weights of the neonates at one, two, three, and four weeks after birth for the analysis. All weights were standardized to Z-scores using the 2013 Fenton growth chart for preterm infants.18 These Z-scores were used instead of raw weight values for all further analyses. In a prior study we analyzed the DTI scans of a larger cohort of 162 subjects.15 The current study includes subjects born before 32 weeks gestational from our prior study and includes additional subjects that were outside of the age criteria of the prior study. This study was approved by our institutional review board. The requirement for subject consent was waived by the review board given the retrospective nature of the study.
Image acquisition and pre-processing
MRIs were performed on a Siemens 3 T Skyra scanner. The routine structural brain MRI included 3-Dimensional T1 and T2-weighted images as well as axial diffusion weighted images, susceptibility weighted images, and dual-echo T2-weighted images. Axial DTIs were obtained using a single-shot echoplanar imaging sequence: repeat time= 10,200 ms, echo time= 94 ms, Flip angle= 900, field of view 18×18 cm, slice thickness of 2.5 mm, matrix of 128×128, including a single b=0 and 30 noncolinear direction b=1000 s/mm2 acquisitions. We used the FMRIB’s Diffusion Toolbox (FDT) in FMRIB’s Software Library (FSL) to preprocess DTI images by correcting for susceptibility distortions, eddy currents, and subject movement to generate fractional anisotropy (FA), mean diffusivity (MD), radial diffusivity (RD) and axial diffusivity (AD) maps.19
Voxel-wise tract-based spatial statistics (TBSS)
We used TBSS toolbox in FSL for voxel-wise statistical analysis of FA, MD, RD, and AD values along WM tracts.15 Briefly, each FA map was linearly co-registered to all other FA maps to identify the most representative FA map of the cohort. This representative FA map was then co-registered to the MNI-152 (Montreal Neurological Institute) to space, and then other FA maps were co-registered to the MNI-152 space by combining the registration to the representative FA map and the registration from the representative FA map to the MNI-152 space. A similar process was utilized to co-register all MD, RD, and AD maps to the MNI-152 space. The mean of the aligned FA maps was calculated followed by applying a threshold of 0.1 to generate a skeletonized WM tract map across all neonates. All skeletonized FA maps were visually inspected for anatomical accuracy. No subjects were removed or required manual tract revision. Prior to further analyses, all maps generated from the TBSS process were co-registered to a pediatric brain template generated from MRI studies of subjects between 0 and 2 years of age.20 Skeletonized FA maps were again visually inspected for anatomical accuracy following final coregistration. We then used the “randomise” tool in FSL to conduct general linear model (GLM) analyses of the birth weight Z-score associated changes in FA, MD, RD, and AD values across WM tracts while controlling for gestational age at birth and time between birth and scan as covariates. We applied 5000 permutations and threshold-free cluster enhancements while correcting for multiple comparisons across space.19 A color-coded map of p-values (windowed for p values between 0 and 0.05) was overlaid onto the MNI-152 brain template to visualize the results. Additional analyses were conducted to analyze the associated of change in weight Z-scores in the postnatal period with DTI metrics across WM tracts while controlling for gestational age at birth, birth weight Z-score, and time between birth and scan as covariates.
Tract-based analysis
To further verify the voxel-wise TBSS results, additional WM tract-based analyses were conducted on regionally parcellated WM tracts using a John’s Hopkins University WM atlas that was co-registered to the pediatric brain template.20 Figure 1 displays the co-registered John’s Hopkins University WM atlas overlayed on the pediatric brain template. The means of non-zero FA, MD, RD, and AD values in each of 48 specific WM tracts were calculated using FSL for each infant.15 Multiple linear regressions were then applied to determine the association of birth weight Z-scores with DTI metrics in each WM tract while controlling for gestational age at birth and time between birth and scan as covariates. Additional analyses were conducted to analyze the association of changes in weight Z-scores in the postnatal period (up to 4 weeks) with DTI metrics in each of the 48 WM tracts while controlling for gestational age at birth, birth weight Z-score, and time between birth and scan as covariates. P-values adjusted for false discovery rate were also calculated using the Benjamini-Hochberg procedure.21
Figure 1.

Co-registered John’s Hopkins University white matter tract atlas used for tact-based analyses. Individual white matter tracts are displayed in separate rainbow colors. Results are displayed over an atlas generated from MRIs of children between 0 and 2 years of age.
Statistics
The data are represented as mean ± standard deviation, median (interquartile range), or frequency (percentage) as appropriate. The “stats” (version 4.0.3, https://stat.ethz.ch/R-manual/R-devel/library/stats/html/00Index.html) package in R was used for tract-specific multiple linear regression analysis.
RESULTS
Subject characteristics
Figure 2 depicts a flowchart for the inclusion of 91 very preterm infants for our analyses. Table 1 summarizes the demographic characteristics of the infants, and Table 2 summarizes the postnatal weight measurements used in our analyses. Figure 3 displays the distribution of gestational age at birth and scan in our cohort.
Figure 2.
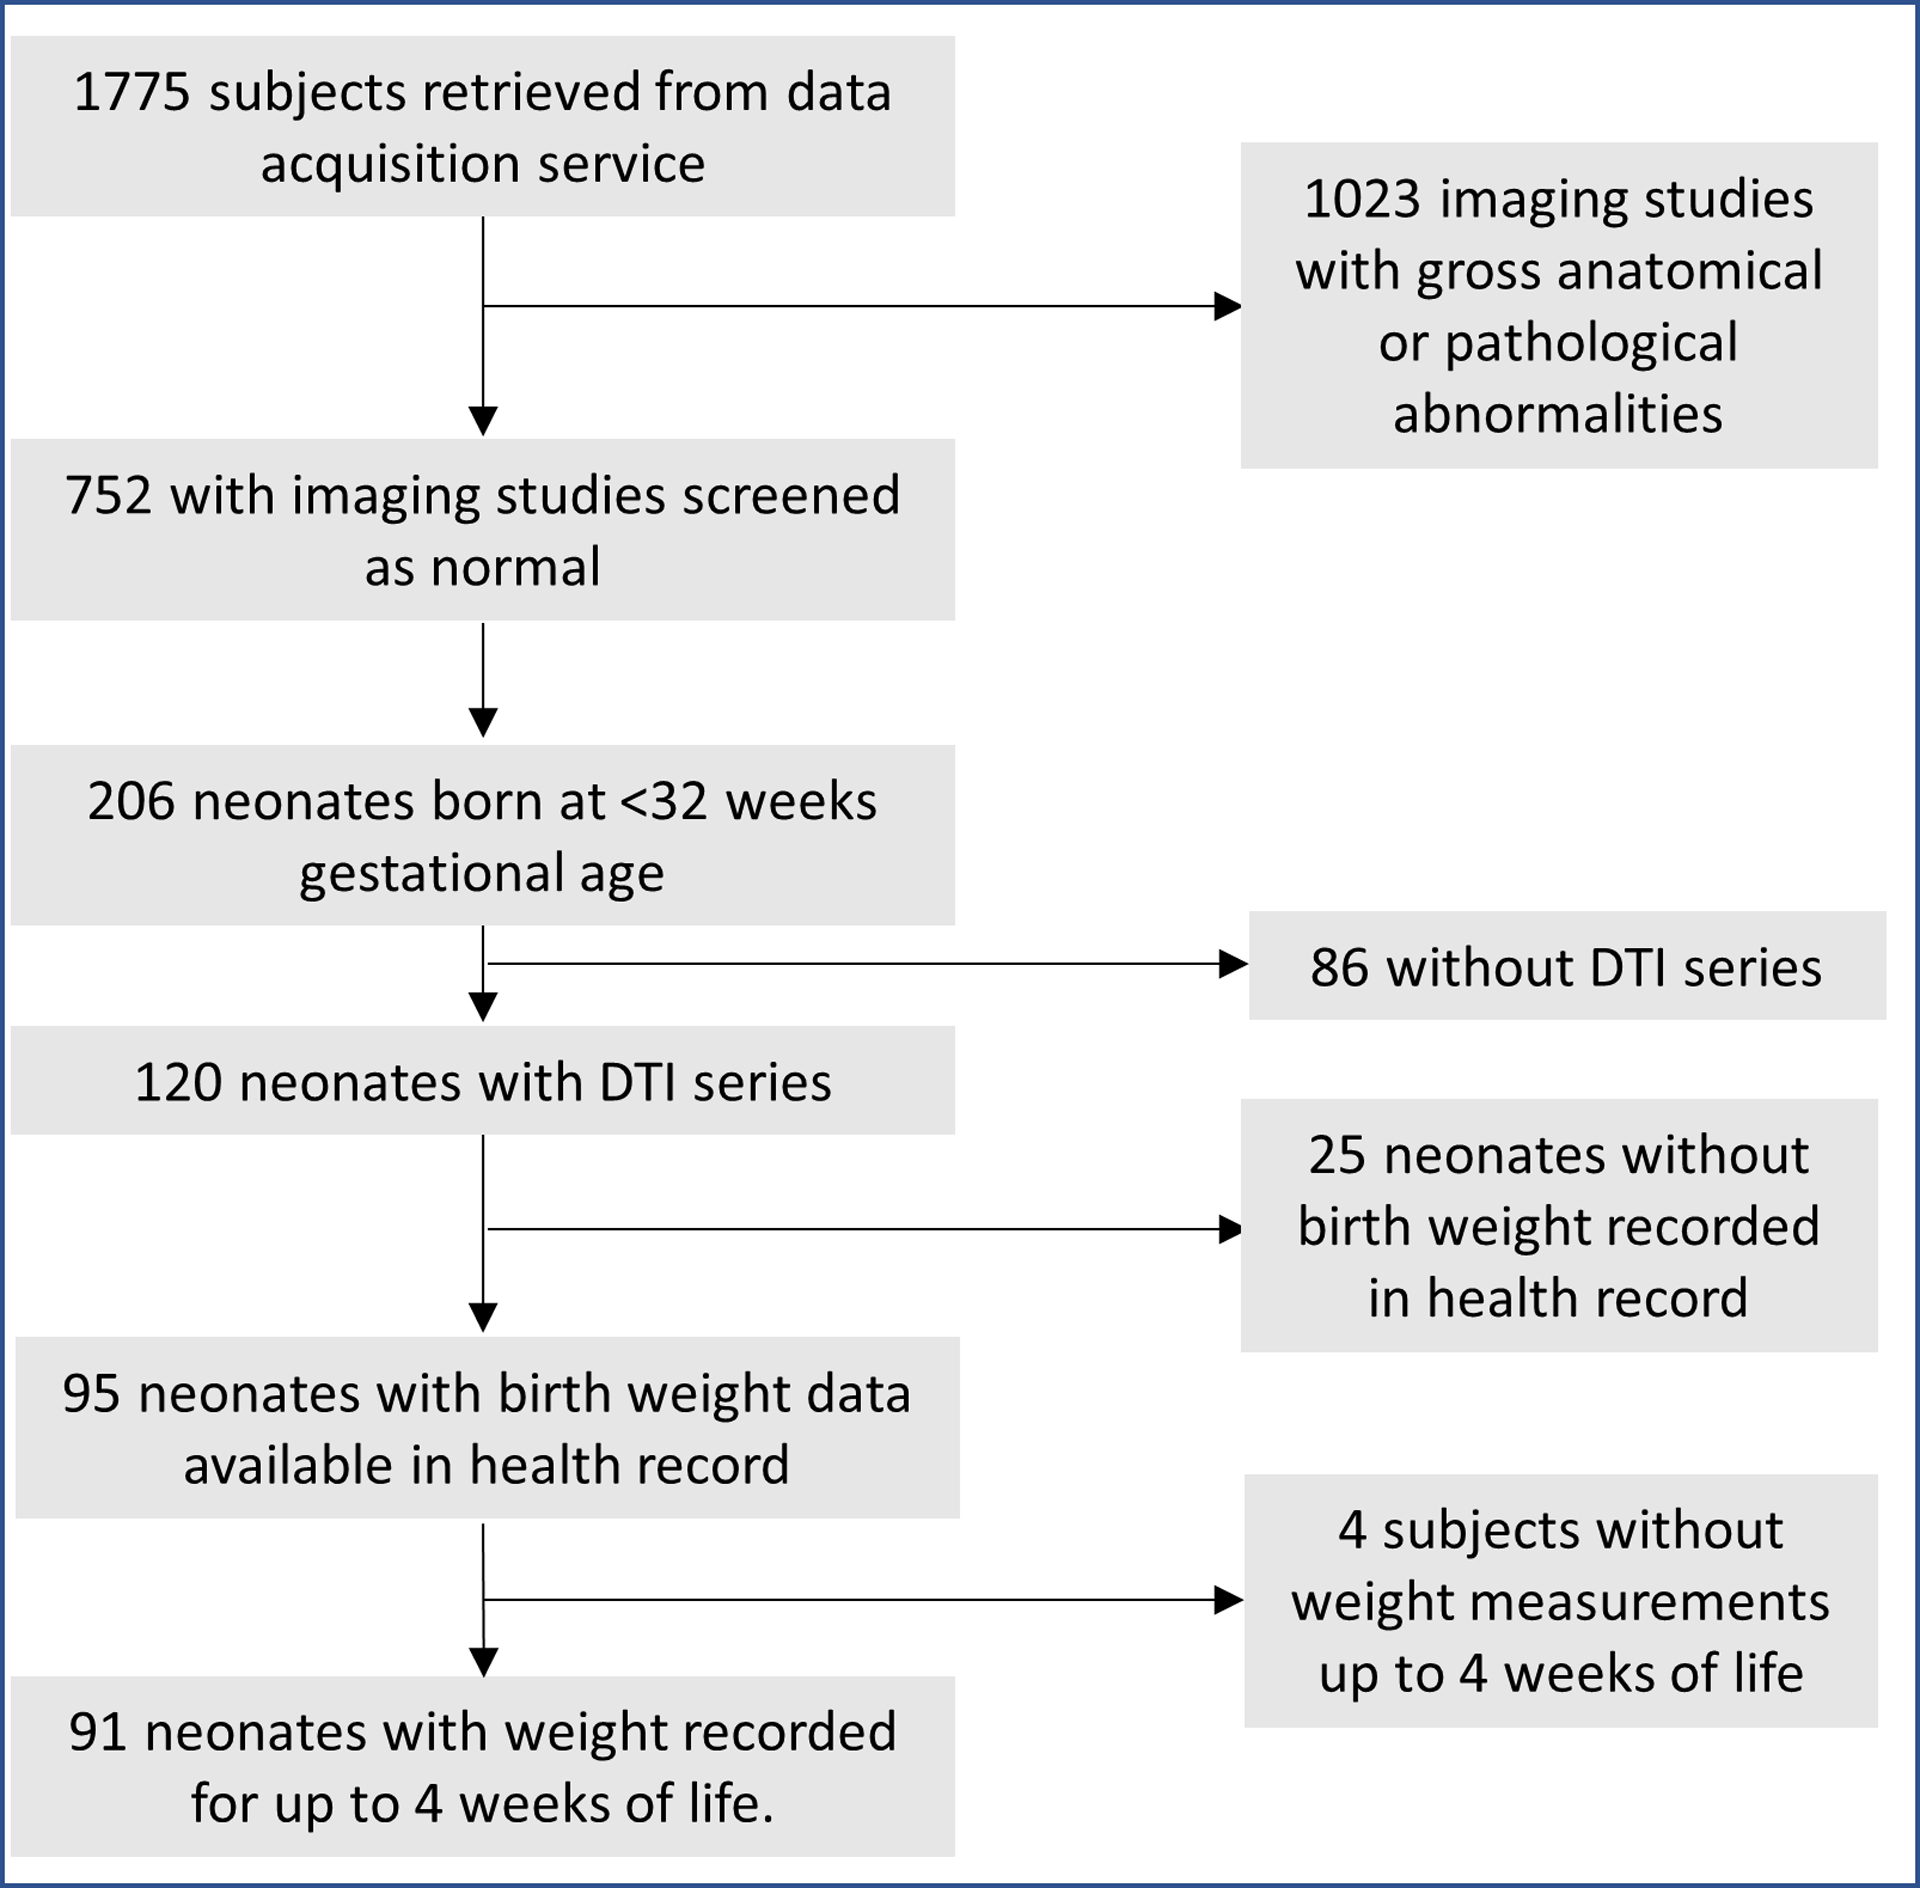
Inclusion flowchart. DTI= Diffusion Tensor Imaging.
Table 1.
Demographic characteristics of the 91 neonates included in our study.
| Clinical Variable | |
|---|---|
| Sex (females) | 44.21% |
| Gestational age at birth (weeks) | 27.00 (26.07–28.00) |
| Gestational age at scan (weeks) | 37.19 (36.24–39.63) |
| Time between birth and scan (weeks) | 10.75 ± 2.85 |
| Birth Weight (grams) | 970.88 ± 282.32 |
| Birth Weight Z-score | 0.06 ± 0.91 |
| Maternal age (years) | 30.74 ± 5.87 |
| 1-minute APGAR | 5 (4–7) |
| 5-minute APGAR | 8 (7–9) |
| Blood Glucose | 69.60 ± 29.00 |
| Hematocrit (%) | 44.17 ± 8.84 |
| Days on respiratory support | 17.05 ± 19.18 |
| Delivery (Cesarean-section) | 72.63% |
| Intubated | 58.95% |
| Meconium-stained amniotic fluid | 8.42% |
| Premature rupture of membranes | 31.58% |
Note: Data are reported as mean ± standard deviation, median (upper-lower bounds of interquartile range), or frequency as a percent. Maternal age data was missing for 2 subjects. Delivery method data was missing for 2 subjects. Blood glucose data was missing for 3 subjects. Hematocrit data was missing for 1 subject.
Table 2.
Summarization of postnatal weight Z scores and changes from birth for the 91 neonates included in our study.
| Postnatal time point | Weight z-score | Change in weight z-score from birth |
|---|---|---|
| 1 week | −0.60 ± 0.62 | −0.62 ± 0.46 |
| 2 weeks | −0.77 ± 0.57 | −0.79 ± 0.46 |
| 3 weeks | −0.86 ± 0.56 | −0.87 ± 0.49 |
| 4 weeks | −0.93 ± 0.61 | −0.94 ± 0.51 |
Note: Data are reported as mean ± standard deviation.
Figure 3.
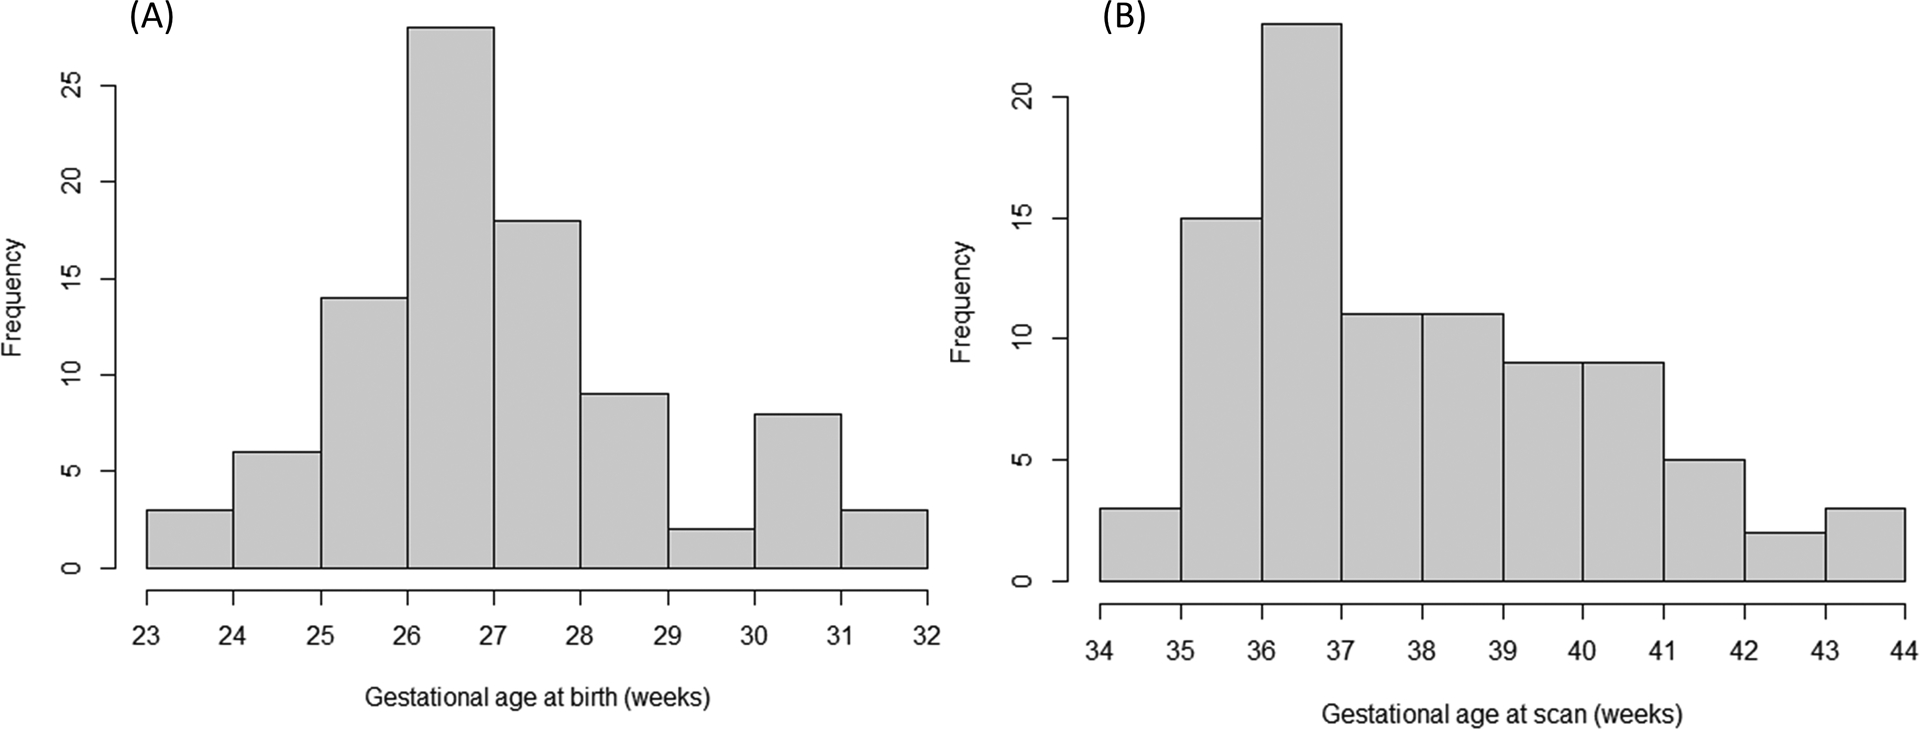
Histogram displaying the distribution of (A) gestational age at birth and (B) gestational age at the time of brain MRI for the study cohort.
Impact of birth weight on WM microstructure
Figure 4 depicts the results of voxel-wise analysis of the associations between birth weight Z-score with FA and RD after controlling for gestational age at birth and time between birth. On tract-based analyses, the FA values of the corpus callosum splenium were positively associated with birth weight Z-score after controlling for gestational age at birth and time between birth and scan (Figure 4A and Table 3). After correction for multiple comparisons, there was no significant association of FA values with birth weight Z-score. There was no significant association of birth weight Z-score with RD values on tract-based analyses. There was no significant association of birth weight Z-score with MD or AD values on voxel-wise or tract-based analyses.
Figure 4.
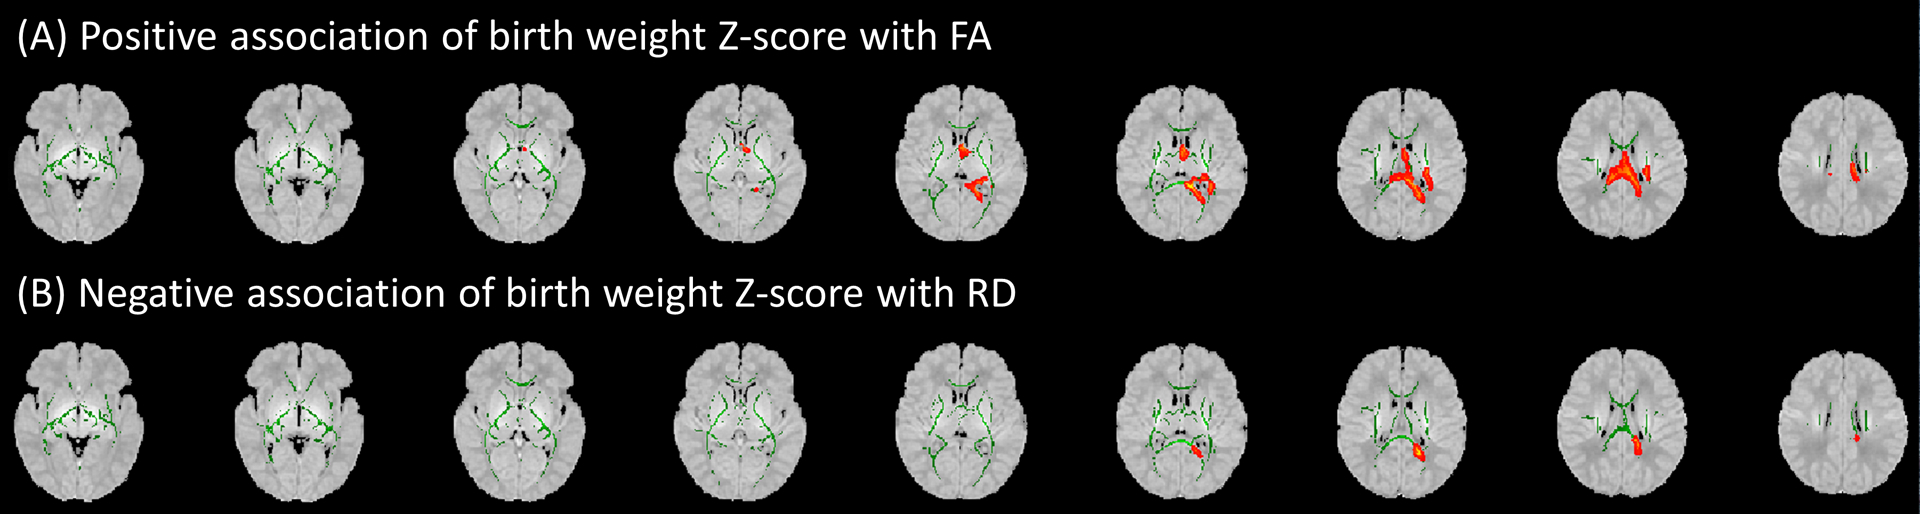
In voxel-wise analysis, the birth weight Z-score of very preterm infants had significant positive association with (A) fractional anisotropy (FA), and negative association with (B) radial diffusivity (RD) in the splenium of corpus callosum and sagittal striatum – after controlling for gestational age at birth and time between birth and scan. Green areas display white matter tract FA skeletons; red areas depict sites where birth weight Z-score was significantly associated (P<0.05) with corresponding diffusion tensor metrics. Results are displayed over an atlas generated from MRIs of children between 0 and 2 years of age.
Table 3.
Tract-based regression analysis of association between birth weight Z-score and fractional anisotropy when controlling for gestational age at birth and time between birth and scan
| Tract | Coefficient (95% Confidence Interval) | p-value |
|---|---|---|
| Middle cerebellar peduncle | 1.45E-03 (−3.47E-03 to 6.36E-03) | 0.56 |
| Pontine crossing tract | 1.42E-03 (−3.31E-03 to 6.14E-03) | 0.55 |
| Genu of corpus callosum | −6.95E-04 (−7.97E-03 to 6.58E-03) | 0.85 |
| Body of corpus callosum | 2.93E-03 (−3.32E-03 to 9.17E-03) | 0.35 |
| Splenium of corpus callosum | 7.13E-03 (9.28E-04 to 1.33E-02) | 0.02* |
| Fornix | 2.10E-03 (−2.44E-03 to 6.63E-03) | 0.36 |
| Corticospinal tract R | 1.28E-03 (−3.44E-03 to 6.00E-03) | 0.59 |
| Corticospinal tract L | 1.57E-03 (−3.14E-03 to 6.27E-03) | 0.51 |
| Medial lemniscus R | 1.08E-03 (−3.53E-03 to 5.68E-03) | 0.64 |
| Medial lemniscus L | 1.50E-03 (−3.08E-03 to 6.07E-03) | 0.52 |
| Inferior cerebellar peduncle R | 1.50E-03 (−2.82E-03 to 5.82E-03) | 0.49 |
| Inferior cerebellar peduncle L | 1.34E-03 (−3.21E-03 to 5.89E-03) | 0.56 |
| Superior cerebellar peduncle R | 1.44E-03 (−3.01E-03 to 5.90E-03) | 0.52 |
| Superior cerebellar peduncle L | 1.25E-03 (−3.11E-03 to 5.61E-03) | 0.57 |
| Cerebral peduncle R | 1.92E-04 (−3.78E-03 to 4.17E-03) | 0.92 |
| Cerebral peduncle L | 1.49E-03 (−2.90E-03 to 5.87E-03) | 0.50 |
| Anterior limb of internal capsule R | −3.07E-04 (−5.63E-03 to 5.02E-03) | 0.91 |
| Anterior limb of internal capsule L | 2.19E-03 (−3.16E-03 to 7.55E-03) | 0.42 |
| Posterior limb of internal capsule R | 3.71E-03 (−1.25E-03 to 8.66E-03) | 0.14 |
| Posterior limb of internal capsule L | 2.54E-03 (−3.21E-03 to 8.29E-03) | 0.38 |
| Retrolenticular part of internal capsule R | 2.61E-03 (−2.15E-03 to 7.37E-03) | 0.28 |
| Retrolenticular part of internal capsule L | 1.39E-03 (−3.64E-03 to 6.41E-03) | 0.58 |
| Anterior corona radiata R | 8.74E-04 (−3.96E-03 to 5.71E-03) | 0.72 |
| Anterior corona radiata L | 1.69E-03 (−2.70E-03 to 6.09E-03) | 0.45 |
| Superior corona radiata R | 2.26E-03 (−3.61E-03 to 8.13E-03) | 0.45 |
| Superior corona radiata L | 3.40E-03 (−2.29E-03 to 9.09E-03) | 0.24 |
| Posterior corona radiata R | 2.86E-03 (−2.12E-03 to 7.85E-03) | 0.26 |
| Posterior corona radiata L | 5.14E-03 (−2.52E-04 to 1.05E-02) | 0.06 |
| Posterior thalamic radiation R | 3.19E-03 (−1.59E-03 to 7.96E-03) | 0.19 |
| Posterior thalamic radiation L | −1.39E-04 (−5.23E-03 to 4.96E-03) | 0.96 |
| Sagittal striatum R | 3.05E-03 (−2.52E-03 to 8.62E-03) | 0.28 |
| Sagittal striatum L | 3.58E-04 (−5.89E-03 to 6.61E-03) | 0.91 |
| External capsule R | −9.28E-04 (−7.35E-03 to 5.50E-03) | 0.77 |
| External capsule L | −1.71E-03 (−7.22E-03 to 3.80E-03) | 0.54 |
| Cingulum (cingulate gyrus) R | 5.44E-04 (−6.04E-03 to 7.13E-03) | 0.87 |
| Cingulum (cingulate gyrus) L | −4.37E-04 (−7.23E-03 to 6.35E-03) | 0.90 |
| Cingulum (hippocampus) R | 3.53E-04 (−5.52E-03 to 6.22E-03) | 0.91 |
| Cingulum (hippocampus) L | 2.44E-03 (−3.18E-03 to 8.05E-03) | 0.39 |
| Fornix (cres) / Stria terminalis R | 9.77E-04 (−4.92E-03 to 6.87E-03) | 0.74 |
| Fornix (cres) / Stria terminalis L | 1.06E-03 (−4.79E-03 to 6.91E-03) | 0.72 |
| Superior longitudinal fasciculus R | 2.34E-03 (−3.19E-03 to 7.88E-03) | 0.40 |
| Superior longitudinal fasciculus L | 3.43E-03 (−2.03E-03 to 8.88E-03) | 0.22 |
| Superior fronto-occipital fasciculus R | 1.09E-03 (−6.73E-03 to 8.90E-03) | 0.78 |
| Superior fronto-occipital fasciculus L | 3.11E-03 (−3.14E-03 to 9.36E-03) | 0.33 |
| Uncinate fasciculus R | 3.93E-04 (−6.96E-03 to 7.75E-03) | 0.92 |
| Uncinate fasciculus L | −2.01E-03 (−8.74E-03 to 4.72E-03) | 0.55 |
| Tapetum R | −1.48E-03 (−9.85E-03 to 6.89E-03) | 0.73 |
| Tapetum L | 1.76E-03 (−8.14E-03 to 1.17E-02) | 0.72 |
Note- Coefficients of regression, upper and lower bounds of a 95% confidence interval, and unadjusted p-values are provided for regressions performed in each white matter tract. Significant (<0.05) p-values are indicated by an asterisk (*). L = left. R = right.
Impact of postnatal weight changes on WM microstructure
Although on voxel-wise GLM analysis, there was no significant association between weight Z-score changes from birth to 4 weeks of life with FA values (minimum p-value of 0.19), in tract-based analysis, the FA values of the right anterior corona radiata and right superior fronto-occipital fasciculus were positively associated with weight Z-score changes over the 4 weeks from birth after controlling for gestational age at birth, birth weight Z-score, and time between birth and scan (Table 4). In both voxel-wise and tract-based analyses, MD values (Figure 5A and Table 5) in the the corpus callosum body, bilateral posterior limb of internal capsule, bilateral retrolenticular internal capsule, left superior and posterior corona radiata, bilateral sagittal striatum and right external capsule MD values as well as RD values (Figure 5B and Table 6) in the pontine crossing tract, corpus callosum body, cerebral peduncle, bilateral posterior limb of the internal capsule, bilateral retrolenticular internal capsule, left superior and posterior corona radiata, bilateral sagittal striatum and right external capsule ) were negatively associated with weight Z-score changes from birth to 4 weeks of life after controlling for gestational age at birth, birth weight Z-score, and time between birth and scan. After correction for multiple comparisons, there was no significant association of FA, MD, or RD values with weight Z-score changes from birth to 4 weeks of life. We found no significant association of change in weight Z-score from birth to 4 weeks of life with AD values on voxel-wise or tract-based linear regression analysis. We also found no significant association between weight Z-scores changes from birth to one, two, or three weeks of life with any DTI metrics.
Table 4.
Tract-based regression analysis of association between birth weight Z-score changes over the first four weeks of life and fractional anisotropy when controlling for gestational age at birth, birth weight z-score and time between birth and scan
| Tract | Coefficient (95% Confidence Interval) | p-value |
|---|---|---|
| Middle cerebellar peduncle | 5.13E-03 (−7.01E-03 to 1.73E-02) | 0.40 |
| Pontine crossing tract | 7.30E-03 (−4.32E-03 to 1.89E-02) | 0.22 |
| Genu of corpus callosum | 4.69E-03 (−1.33E-02 to 2.27E-02) | 0.61 |
| Body of corpus callosum | 9.15E-03 (−6.20E-03 to 2.45E-02) | 0.24 |
| Splenium of corpus callosum | 7.99E-03 (−7.30E-03 to 2.33E-02) | 0.30 |
| Fornix | 6.72E-03 (−4.43E-03 to 1.79E-02) | 0.23 |
| Corticospinal tract R | 7.06E-03 (−4.54E-03 to 1.87E-02) | 0.23 |
| Corticospinal tract L | 8.15E-03 (−3.39E-03 to 1.97E-02) | 0.16 |
| Medial lemniscus R | 7.46E-03 (−3.84E-03 to 1.88E-02) | 0.19 |
| Medial lemniscus L | 5.64E-03 (−5.63E-03 to 1.69E-02) | 0.32 |
| Inferior cerebellar peduncle R | 7.58E-03 (−3.00E-03 to 1.82E-02) | 0.16 |
| Inferior cerebellar peduncle L | 6.68E-03 (−4.50E-03 to 1.79E-02) | 0.24 |
| Superior cerebellar peduncle R | 7.60E-03 (−3.33E-03 to 1.85E-02) | 0.17 |
| Superior cerebellar peduncle L | 6.74E-03 (−3.98E-03 to 1.75E-02) | 0.21 |
| Cerebral peduncle R | 5.59E-03 (−4.19E-03 to 1.54E-02) | 0.26 |
| Cerebral peduncle L | 6.72E-03 (−4.06E-03 to 1.75E-02) | 0.22 |
| Anterior limb of internal capsule R | 1.95E-03 (−1.12E-02 to 1.51E-02) | 0.77 |
| Anterior limb of internal capsule L | 7.28E-03 (−5.90E-03 to 2.05E-02) | 0.28 |
| Posterior limb of internal capsule R | 5.09E-03 (−7.15E-03 to 1.73E-02) | 0.41 |
| Posterior limb of internal capsule L | 6.29E-03 (−7.90E-03 to 2.05E-02) | 0.38 |
| Retrolenticular part of internal capsule R | 8.91E-03 (−2.73E-03 to 2.05E-02) | 0.13 |
| Retrolenticular part of internal capsule L | 9.47E-03 (−2.82E-03 to 2.18E-02) | 0.13 |
| Anterior corona radiata R | 1.20E-02 (2.51E-04 to 2.37E-02) | 0.045* |
| Anterior corona radiata L | 4.50E-03 (−6.36E-03 to 1.54E-02) | 0.41 |
| Superior corona radiata R | 9.65E-03 (−4.75E-03 to 2.41E-02) | 0.19 |
| Superior corona radiata L | 8.04E-03 (−5.97E-03 to 2.20E-02) | 0.26 |
| Posterior corona radiata R | 7.90E-03 (−4.35E-03 to 2.02E-02) | 0.20 |
| Posterior corona radiata L | 8.92E-03 (−4.32E-03 to 2.22E-02) | 0.18 |
| Posterior thalamic radiation R | 1.06E-03 (−1.08E-02 to 1.29E-02) | 0.86 |
| Posterior thalamic radiation L | 6.27E-03 (−6.29E-03 to 1.88E-02) | 0.32 |
| Sagittal striatum R | 5.29E-03 (−8.48E-03 to 1.91E-02) | 0.45 |
| Sagittal striatum L | 5.25E-03 (−1.02E-02 to 2.07E-02) | 0.50 |
| External capsule R | −6.66E-04 (−1.66E-02 to 1.53E-02) | 0.93 |
| External capsule L | −1.54E-03 (−1.52E-02 to 1.21E-02) | 0.82 |
| Cingulum (cingulate gyrus) R | 1.31E-02 (−2.99E-03 to 2.92E-02) | 0.11 |
| Cingulum (cingulate gyrus) L | 1.08E-02 (−5.88E-03 to 2.75E-02) | 0.20 |
| Cingulum (hippocampus) R | 9.70E-03 (−4.71E-03 to 2.41E-02) | 0.18 |
| Cingulum (hippocampus) L | 6.43E-03 (−7.43E-03 to 2.03E-02) | 0.36 |
| Fornix (cres) / Stria terminalis R | 8.63E-03 (−5.88E-03 to 2.31E-02) | 0.24 |
| Fornix (cres) / Stria terminalis L | 6.37E-03 (−8.07E-03 to 2.08E-02) | 0.38 |
| Superior longitudinal fasciculus R | 6.99E-03 (−6.65E-03 to 2.06E-02) | 0.31 |
| Superior longitudinal fasciculus L | 1.15E-02 (−1.77E-03 to 2.48E-02) | 0.09 |
| Superior fronto-occipital fasciculus R | 2.36E-02 (4.91E-03 to 4.23E-02) | 0.01* |
| Superior fronto-occipital fasciculus L | 1.34E-02 (−1.85E-03 to 2.86E-02) | 0.08 |
| Uncinate fasciculus R | 6.81E-03 (−1.14E-02 to 2.50E-02) | 0.46 |
| Uncinate fasciculus L | 9.34E-03 (−7.23E-03 to 2.59E-02) | 0.27 |
| Tapetum R | 7.99E-03 (−1.27E-02 to 2.87E-02) | 0.44 |
| Tapetum L | 2.25E-02 (−1.52E-03 to 4.66E-02) | 0.07 |
Note- Coefficients of regression, upper and lower bounds of a 95% confidence interval, and unadjusted p-values are provided for regressions performed in each white matter tract. Significant (<0.05) p-values are indicated by an asterisk (*). L = left. R = right.
Figure 5.
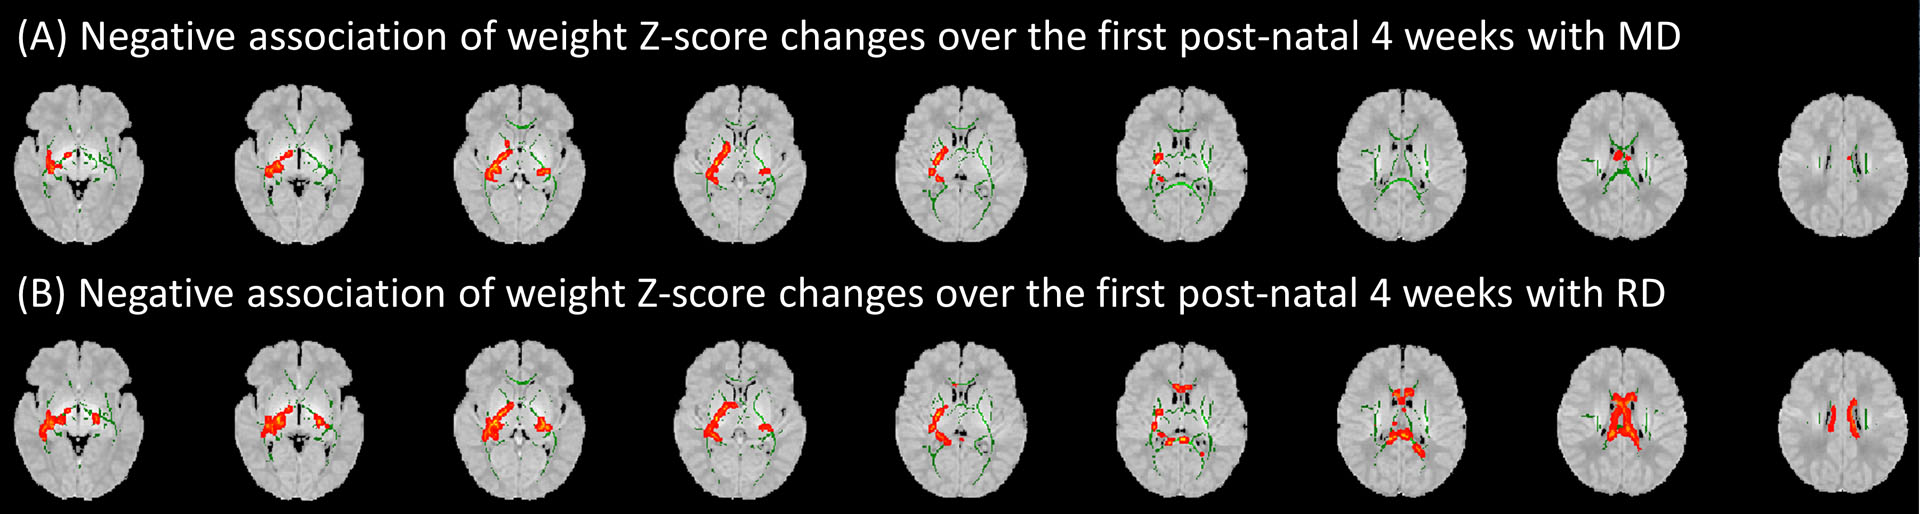
Voxel-wise analysis showed an association between post-natal weight Z-score changes over the first 4 weeks of life with (A) mean diffusivity (MD) and (B) radial diffusivity (RD) when controlling for gestational age at birth, birth weight Z-score, and time between birth and scan. Green areas display white matter tract fractional anisotropy skeletons; red areas depict sites where change in weight Z-score in the first 4 weeks of life was significantly associated (P<0.05) with corresponding diffusion tensor metrics. Results are displayed over an atlas generated from MRIs of children between 0 and 2 years of age.
Table 5.
Tract-based regression analysis of association between birth weight Z-score changes over the first four weeks of life and mean diffusivity when controlling for gestational age at birth, birth weight z-score and time between birth and scan
| Tract | Coefficient (95% Confidence Interval) | p-value |
|---|---|---|
| Middle cerebellar peduncle | −1.45E-05 (−7.29E-05 to 4.39E-05) | 0.62 |
| Pontine crossing tract | −4.71E-05 (−9.59E-05 to 1.75E-06) | 0.06 |
| Genu of corpus callosum | −4.16E-05 (−9.46E-05 to 1.15E-05) | 0.12 |
| Body of corpus callosum | −1.02E-04 (−1.77E-04 to −2.81E-05) | 0.01* |
| Splenium of corpus callosum | −4.46E-05 (−9.78E-05 to 8.62E-06) | 0.10 |
| Fornix | −1.98E-05 (−6.88E-05 to 2.92E-05) | 0.42 |
| Corticospinal tract R | −8.87E-06 (−5.82E-05 to 4.05E-05) | 0.72 |
| Corticospinal tract L | −2.80E-05 (−8.26E-05 to 2.66E-05) | 0.31 |
| Medial lemniscus R | −3.86E-05 (−8.45E-05 to 7.24E-06) | 0.10 |
| Medial lemniscus L | −3.26E-05 (−7.89E-05 to 1.36E-05) | 0.16 |
| Inferior cerebellar peduncle R | −3.90E-05 (−8.13E-05 to 3.32E-06) | 0.07 |
| Inferior cerebellar peduncle L | −3.76E-05 (−7.94E-05 to 4.15E-06) | 0.08 |
| Superior cerebellar peduncle R | −4.22E-05 (−8.86E-05 to 4.18E-06) | 0.07 |
| Superior cerebellar peduncle L | −3.92E-05 (−8.09E-05 to 2.62E-06) | 0.07 |
| Cerebral peduncle R | −2.90E-05 (−7.04E-05 to 1.24E-05) | 0.17 |
| Cerebral peduncle L | −1.83E-05 (−5.66E-05 to 2.00E-05) | 0.34 |
| Anterior limb of internal capsule R | −2.92E-05 (−6.40E-05 to 5.64E-06) | 0.10 |
| Anterior limb of internal capsule L | −3.93E-05 (−8.17E-05 to 3.19E-06) | 0.07 |
| Posterior limb of internal capsule R | −3.19E-05 (−5.79E-05 to −5.81E-06) | 0.02* |
| Posterior limb of internal capsule L | −2.91E-05 (−5.68E-05 to −1.36E-06) | 0.04* |
| Retrolenticular part of internal capsule R | −4.94E-05 (−8.90E-05 to −9.82E-06) | 0.02* |
| Retrolenticular part of internal capsule L | −4.91E-05 (−8.96E-05 to −8.65E-06) | 0.02* |
| Anterior corona radiata R | −5.31E-05 (−1.21E-04 to 1.51E-05) | 0.13 |
| Anterior corona radiata L | −3.58E-05 (−1.05E-04 to 3.30E-05) | 0.30 |
| Superior corona radiata R | −4.39E-05 (−1.11E-04 to 2.27E-05) | 0.19 |
| Superior corona radiata L | −6.41E-05 (−1.27E-04 to −1.15E-06) | 0.046* |
| Posterior corona radiata R | −5.59E-05 (−1.32E-04 to 2.03E-05) | 0.15 |
| Posterior corona radiata L | −7.98E-05 (−1.58E-04 to −1.44E-06) | 0.046* |
| Posterior thalamic radiation R | −3.94E-05 (−9.68E-05 to 1.79E-05) | 0.18 |
| Posterior thalamic radiation L | −5.96E-05 (−1.34E-04 to 1.51E-05) | 0.12 |
| Sagittal striatum R | −4.53E-05 (−8.82E-05 to −2.50E-06) | 0.04* |
| Sagittal striatum L | −4.76E-05 (−9.51E-05 to −9.88E-08) | 0.0495* |
| External capsule R | −3.99E-05 (−7.47E-05 to −5.18E-06) | 0.02* |
| External capsule L | −3.03E-05 (−6.40E-05 to 3.46E-06) | 0.08 |
| Cingulum (cingulate gyrus) R | −1.81E-05 (−6.26E-05 to 2.65E-05) | 0.42 |
| Cingulum (cingulate gyrus) L | −2.52E-05 (−7.16E-05 to 2.13E-05) | 0.28 |
| Cingulum (hippocampus) R | −2.14E-05 (−6.16E-05 to 1.87E-05) | 0.29 |
| Cingulum (hippocampus) L | −4.26E-05 (−9.44E-05 to 9.15E-06) | 0.11 |
| Fornix (cres) / Stria terminalis R | −2.70E-05 (−6.67E-05 to 1.27E-05) | 0.18 |
| Fornix (cres) / Stria terminalis L | −4.19E-05 (−9.32E-05 to 9.27E-06) | 0.11 |
| Superior longitudinal fasciculus R | −2.76E-05 (−8.76E-05 to 3.23E-05) | 0.36 |
| Superior longitudinal fasciculus L | −4.52E-05 (−1.02E-04 to 1.22E-05) | 0.12 |
| Superior fronto-occipital fasciculus R | −4.39E-05 (−1.14E-04 to 2.65E-05) | 0.22 |
| Superior fronto-occipital fasciculus L | −5.14E-05 (−1.24E-04 to 2.17E-05) | 0.17 |
| Uncinate fasciculus R | −8.35E-05 (−1.74E-04 to 6.56E-06) | 0.07 |
| Uncinate fasciculus L | −6.28E-05 (−1.77E-04 to 5.15E-05) | 0.28 |
| Tapetum R | −8.08E-05 (−2.90E-04 to 1.29E-04) | 0.45 |
| Tapetum L | −2.06E-04 (−4.69E-04 to 5.72E-05) | 0.12 |
Note- Coefficients of regression, upper and lower bounds of a 95% confidence interval, and unadjusted p-values are provided for regressions performed in each white matter tract. Significant (<0.05) p-values are indicated by an asterisk (*). L = left. R = right.
Table 6.
Tract-based regression analysis of association between birth weight Z-score changes over the first four weeks of life and radial diffusivity when controlling for gestational age at birth, birth weight z-score and time between birth and scan
| Tract | Coefficient (95% Confidence Interval) | p-value |
|---|---|---|
| Middle cerebellar peduncle | −1.76E-05 (−7.43E-05 to 3.90E-05) | 0.54 |
| Pontine crossing tract | −4.94E-05 (−9.54E-05 to −3.38E-06) | 0.04* |
| Genu of corpus callosum | −4.31E-05 (−9.22E-05 to 6.04E-06) | 0.08 |
| Body of corpus callosum | −1.03E-04 (−1.72E-04 to −3.32E-05) | 0.004* |
| Splenium of corpus callosum | −4.72E-05 (−1.01E-04 to 6.75E-06) | 0.09 |
| Fornix | −2.39E-05 (−7.13E-05 to 2.35E-05) | 0.32 |
| Corticospinal tract R | −1.41E-05 (−6.26E-05 to 3.45E-05) | 0.57 |
| Corticospinal tract L | −3.17E-05 (−8.31E-05 to 1.96E-05) | 0.22 |
| Medial lemniscus R | −4.19E-05 (−8.55E-05 to 1.68E-06) | 0.06 |
| Medial lemniscus L | −3.48E-05 (−7.87E-05 to 9.14E-06) | 0.12 |
| Inferior cerebellar peduncle R | −4.21E-05 (−8.28E-05 to −1.50E-06) | 0.04* |
| Inferior cerebellar peduncle L | −3.99E-05 (−8.00E-05 to 2.16E-07) | 0.05 |
| Superior cerebellar peduncle R | −4.50E-05 (−8.93E-05 to −7.55E-07) | 0.046* |
| Superior cerebellar peduncle L | −4.11E-05 (−8.09E-05 to −1.27E-06) | 0.04* |
| Cerebral peduncle R | −3.05E-05 (−7.07E-05 to 9.57E-06) | 0.13 |
| Cerebral peduncle L | −2.15E-05 (−5.87E-05 to 1.57E-05) | 0.25 |
| Anterior limb of internal capsule R | −2.79E-05 (−6.41E-05 to 8.28E-06) | 0.13 |
| Anterior limb of internal capsule L | −4.19E-05 (−8.51E-05 to 1.28E-06) | 0.06 |
| Posterior limb of internal capsule R | −3.17E-05 (−5.69E-05 to −6.42E-06) | 0.01* |
| Posterior limb of internal capsule L | −3.05E-05 (−5.89E-05 to −2.13E-06) | 0.04* |
| Retrolenticular part of internal capsule R | −5.05E-05 (−9.06E-05 to −1.04E-05) | 0.01* |
| Retrolenticular part of internal capsule L | −5.16E-05 (−9.26E-05 to −1.06E-05) | 0.01* |
| Anterior corona radiata R | −5.93E-05 (−1.24E-04 to 5.71E-06) | 0.07 |
| Anterior corona radiata L | −3.68E-05 (−1.03E-04 to 2.89E-05) | 0.27 |
| Superior corona radiata R | −4.76E-05 (−1.13E-04 to 1.75E-05) | 0.15 |
| Superior corona radiata L | −6.38E-05 (−1.26E-04 to −1.80E-06) | 0.04* |
| Posterior corona radiata R | −5.85E-05 (−1.32E-04 to 1.54E-05) | 0.12 |
| Posterior corona radiata L | −8.13E-05 (−1.58E-04 to −4.80E-06) | 0.04* |
| Posterior thalamic radiation R | −3.66E-05 (−8.78E-05 to 1.45E-05) | 0.16 |
| Posterior thalamic radiation L | −6.28E-05 (−1.34E-04 to 7.97E-06) | 0.08 |
| Sagittal striatum R | −4.52E-05 (−8.98E-05 to −7.45E-07) | 0.046* |
| Sagittal striatum L | −4.87E-05 (−9.52E-05 to −2.09E-06) | 0.04* |
| External capsule R | −3.69E-05 (−7.33E-05 to −4.79E-07) | 0.047* |
| External capsule L | −2.75E-05 (−6.12E-05 to 6.10E-06) | 0.11 |
| Cingulum (cingulate gyrus) R | −2.71E-05 (−6.32E-05 to 8.95E-06) | 0.14 |
| Cingulum (cingulate gyrus) L | −3.27E-05 (−7.20E-05 to 6.66E-06) | 0.10 |
| Cingulum (hippocampus) R | −2.83E-05 (−6.74E-05 to 1.09E-05) | 0.15 |
| Cingulum (hippocampus) L | −4.49E-05 (−9.52E-05 to 5.35E-06) | 0.08 |
| Fornix (cres) / Stria terminalis R | −3.11E-05 (−7.13E-05 to 9.04E-06) | 0.13 |
| Fornix (cres) / Stria terminalis L | −4.40E-05 (−9.45E-05 to 6.48E-06) | 0.09 |
| Superior longitudinal fasciculus R | −3.25E-05 (−8.91E-05 to 2.41E-05) | 0.26 |
| Superior longitudinal fasciculus L | −5.22E-05 (−1.06E-04 to 2.11E-06) | 0.06 |
| Superior fronto-occipital fasciculus R | −5.86E-05 (−1.25E-04 to 8.28E-06) | 0.09 |
| Superior fronto-occipital fasciculus L | −5.68E-05 (−1.28E-04 to 1.46E-05) | 0.12 |
| Uncinate fasciculus R | −8.36E-05 (−1.73E-04 to 5.39E-06) | 0.07 |
| Uncinate fasciculus L | −6.47E-05 (−1.79E-04 to 4.93E-05) | 0.26 |
| Tapetum R | −8.24E-05 (−2.91E-04 to 1.27E-04) | 0.44 |
| Tapetum L | −2.22E-04 (−4.91E-04 to 4.62E-05) | 0.10 |
Note- Coefficients of regression, upper and lower bounds of a 95% confidence interval, and unadjusted p-values are provided for regressions performed in each white matter tract. Significant (<0.05) p-values are indicated by an asterisk (*). L = left. R = right.
DISCUSSION
Applying voxel-wise and tract-based analyses, we showed that higher birth weight Z-scores of VPIs are associated with DTI markers of more mature WM in the corpus callosum, and sagittal striatum – after correction for gestational age at birth and time between birth and scan. In addition, we showed the weight Z-score changes over the first 4 weeks of life are also associated with more mature WM in similar areas – after correction for birth weight Z-scores, gestational age at birth, and time between birth and scan. These results suggest that higher weight gain (or less weight loss) during the first few weeks of postnatal period can improve WM maturation in VPIs, independent of low birth weight and gestational age. These effects are detectable on discharge DTI and most noticeable in posterior commissural WM tracts in corpus callosum – and to lesser extent, the corticospinal tract passing though posterior limb of internal capsule (Figures 2 and 3).
As neonatal brains mature, WM myelination and other processes such as fiber organization restrict water movement along WM tracts, leading to an increase in FA values and decrease in diffusivity metrics such as MD and RD.15,22,23 Several studies indicate that DTI metrics in term and preterm infants are associated with motor and cognitive outcomes at 1–2 years.24,25 Long-term studies of preterm children also show association between term-equivalent DTI metrics in corticospinal tract with Gross Motor Functional scale at 4 years of age;26 and low FA values of internal capsule with visual motor and visual perceptual deficits at 15 years of age.27 Although neuroimaging information alone cannot account for the complex nature of VPIs’ brain development, they can still provide an early indicator of long-term outcome – especially in neonates with unremarkable neurological exam and routine MRI.28
It has long been established that low birth weight is a risk factor for poor cognitive and neuro-developmental outcomes.29,30 More recent studies have utilized the power of advanced neuroimaging techniques such as DTI to provide a neurobiological explanation for this phenomenon. Multiple studies have found lower FA values and increased diffusivity across numerous WM tracts in neonates of low birth weight. Similar to our results, such changes have been more prominently identified in the corpus callosum in prior studies.31,32 These disruptions in WM maturation have also been linked to poor long-term neurological outcomes including impairment in executive function, poor language development, and poor motor function.33–35 Prior studies have also found that such alterations in the WM microstructure of persist into young adulthood, suggesting that low birth weight may permanently affect brain maturation and subsequent neurological outcomes.36,37 In addition to low birth weight, low gestational age has also been identified as a risk factor for poor WM maturation. Prior studies have found that gestational age at birth is positively correlated with FA values and negatively correlated with diffusivity in numerous WM tracts, most prominently in the corpus callosum.15,38 Thus, VPIs are especially at risk for poor WM maturation and subsequent neurological delay due to both low gestational age and weight at the time of birth. In this study, we have pinpointed those WM tracts which are particularly vulnerable to lower birth weight among VPIs independent of gestational age at birth. We also showed that early maturation of similar WM tracts is influenced by weight changes over the first few weeks after birth.
Despite the significant consequences of low birth weight on WM maturation and long-term neurological outcomes in VPIs, these adverse outcomes can potentially be mitigated by postnatal weight gain. Many prior studies have described the positive effects of maintaining postnatal weight through various nutritional interventions on long-term neurological outcomes in the areas of cognition, motor development, and psychomotor development.6,10,39 Vinall et al. have also shown that DTI can capture the effect of postnatal growth delay on cortical maturation in VPIs.40 Our study provides a neurobiological explanation for these findings and improves on prior works by showing that increased weight gain (or less weight loss) over the first 4 postnatal weeks are associated with imaging metrics of WM maturation in the corpus callous and posterior limb of the internal capsule of VPIs at the voxel-level – independent of gestational age and weight at the time of birth. Thus, our findings can serve as potential imaging markers for future nutritional interventions aimed at improving postnatal weight gain in VPIs. Neuroimaging via DTI at term equivalent can substantially complement neurological exam in the prognostication of long-term outcome given the limitations of physical exams in infants.16,17 Of note, the VPIs included in our study had no evident neurological deficits on physical exam or structural/signal abnormality on routine MRI, which further highlights the prognostic advantages of advanced neuroimaging studies such as DTI for evaluation of brain microstructure in these infants.
Although not widely studied, few prior works have utilized DTI to examine how nutrition affects WM maturation. One found that increased duration of human milk use was associated with increased FA values in the corpus callosum of extremely preterm infants.41 Increased nutrient supplementation to infants born at very low birth weights has also been linked to improved WM maturation as evidenced by reduced diffusivity.42 More recently, Sato et al. examined the impact of nutrition on both WM maturation and cognitive outcomes, finding that very low birth weight infants who received enteral nutritional supplementation displayed greater maturation in WM tracts such as the corpus callosum on DTI and improved cognitive outcomes.43 Our work adds to the body of knowledge in this field that will inform the design of future studies. Our results specifically highlight the WM tracts and DTI metrics which can potentially serve as neuroimaging biomarkers to assess neurodevelopmental effect of nutritional interventions targeting postnatal weight gain.
Our study is limited by its single-center, retrospective design and relatively small sample size. This could perhaps explain why our voxel-wise GLM analyses were not adequately powered to detect associations between birth weight Z-score with MD, as well as change in birth weight Z-score in the first 4 postnatal weeks with FA. Additionally, despite significance observed on GLM and unadjusted tract-based analyses, tract-based analyses corrected for multiple comparisons failed to achieve statistical significance when testing the association of DTI metrics with either birth weight Z-score or 4-week change in Z-score. The analysis of DTI metrics can be affected by acquisition protocol and timing, as well as the processing methods used to generate the FA, MD, RD, and AD maps. Additionally, in actively developing and organizing WM during infancy, the relatively low anisotropy levels may complicate the generation and subsequent analysis of FA skeletonization during TBSS. Although we controlled for factors such as gestational age at birth, time between birth and scan, and birth weight, we could not correct for all covariates that may explain differences in observed DTI metric values between the subjects in this study. Of note, nutritional status was not included as a covariate in our analysis as nutritional data were not consistently available in the medical records among all our subjects. We also attempted to obtain length and head circumference data for the subjects included in the study, but found that this information was not reliably recorded in the records of the patients. Finally, given the retrospective nature of this study, we did not assess how alterations in WM maturation influence neurodevelopmental outcomes.
We show that higher birth weight in VPIs, is associated with improved WM maturation, most prominently in the corpus callosum, and sagittal striatum, independent of gestational age at birth and time of pre-discharge scan. We also show that higher weight gain (or less weight loss) over the first four weeks of postnatal period is also associated with improved WM maturation in these regions regardless of birth weight and gestational at birth or time of scan. These findings emphasize the importance of postnatal weight gain to ensure proper WM maturation among VPIs. Our results also highlight the WM tracts and DTI metrics that can potentially serve as a neuroimaging marker to evaluate early neurodevelopmental response to future nutritional interventions aimed at improving postnatal growth.
ACKNOWLEDGEMENTS AND DISCLOSURES
This work has not previously been published in any form. The authors declare no conflict of interest.
Funding:
Pratheek Bobba received support from the National Institute of Diabetes and Digestive and Kidney Diseases of the National Institutes of Health (T35DK104689). Dr. Payabvash received grant support from National Institutes of Health (K23NS118056), Doris Duke Charitable Foundation (2020097) and Foundation of American Society of Neuroradiology. The other authors received no additional support.
REFERENCES
- 1.Barfield WD. Public health implications of very preterm birth. Clin Perinatol 2018;45:565–77. [DOI] [PMC free article] [PubMed] [Google Scholar]
- 2.Helenius K, Sjörs G, Shah PS, et al. Survival in very preterm infants: an international vomparison of 10 national neonatal networks. Pediatrics 2017;140:20171264. [DOI] [PubMed] [Google Scholar]
- 3.Woodward LJ, Moor S, Hood KM, et al. Very preterm children show impairments across multiple neurodevelopmental domains by age 4 years. Archi Dis Child Fetal Neonatal Ed 2009;94:F339–44. [DOI] [PubMed] [Google Scholar]
- 4.Johnson S, Hollis C, Kochhar P, Hennessy E, Wolke D, Marlow N. Psychiatric disorders in extremely preterm children: longitudinal finding at age 11 years in the EPICure study. J Am Acad Child Adolesc Psychiatry 2010;49:453–63. [PubMed] [Google Scholar]
- 5.Platt MJ. Outcomes in preterm infants. Public Health 2014;128:399–403. [DOI] [PubMed] [Google Scholar]
- 6.Ehrenkranz RA, Dusick AM, Vohr BR, Wright LL, Wrage LA, Poole WK. Growth in the neonatal intensive care unit influences neurodevelopmental and growth outcomes of extremely low birth weight infants. Pediatrics 2006;117:1253–61. [DOI] [PubMed] [Google Scholar]
- 7.Belfort MB, Rifas-Shiman SL, Sullivan T et al. Infant growth before and after term: effects on neurodevelopment in preterm infants. Pediatrics 2011;128:e899–e906. [DOI] [PMC free article] [PubMed] [Google Scholar]
- 8.Ramel SE, Demerath EW, Gray HL, Younge N, Boys C, Georgieff MK. The relationship of poor linear growth velocity with neonatal illness and two-year neurodevelopment in preterm infants. Neonatology 2012;102:19–24. [DOI] [PubMed] [Google Scholar]
- 9.Raghuram K, Yang J, Church PT, Cieslak Z, Synnes A, Mukerji A, Shah PS, for the Canadian Neonatal N, Canadian Neonatal Follow-Up Network I. Head Growth Trajectory and Neurodevelopmental Outcomes in Preterm Neonates. Pediatrics 2017;140:e20170216. [DOI] [PubMed] [Google Scholar]
- 10.Shah PS, Wong KY, Merko S, et al. Postnatal growth failure in preterm infants: ascertainment and relation to long-term outcome. J Perinat Med 2006;34:484–9. [DOI] [PubMed] [Google Scholar]
- 11.Coviello C, Keunen K, Kersbergen KJ, et al. Effects of early nutrition and growth on brain volumes, white matter microstructure, and neurodevelopmental outcome in preterm newborns. Pediatr Res 2018;83:102–10. [DOI] [PubMed] [Google Scholar]
- 12.Cormack BE, Harding JE, Miller SP, Bloomfield FH. The influence of early nutrition on brain growth and neurodevelopment in extremely preterm babies: A narrative review. Nutrients 2019;11:2029. [DOI] [PMC free article] [PubMed] [Google Scholar]
- 13.Alexander AL, Lee JE, Lazar M, Field AS. Diffusion tensor imaging of the brain. Neurotherapeutics 2007;4:316–29. [DOI] [PMC free article] [PubMed] [Google Scholar]
- 14.Myers E, Ment LR. Long-term outcome of preterm infants and the role of neuroimaging. Clin Perinatol 2009;36:773–89 [DOI] [PMC free article] [PubMed] [Google Scholar]
- 15.Bobba PS, Weber CF, Mak A, et al. Age-related topographic map of magnetic resonance diffusion metrics in neonatal brains. Hum Brain Mapp 2022;43:4326–34. [DOI] [PMC free article] [PubMed] [Google Scholar]
- 16.Hack M, Taylor HG, Drotar D, et al. Poor predictive validity of the Bayley Scales of Infant Development for cognitive function of extremely low birth weight children at school age. Pediatrics 2005;116:333–41. [DOI] [PubMed] [Google Scholar]
- 17.Voss W, Neubauer AP, Wachtendorf M, Verhey JF, Kattner E. Neurodevelopmental outcome in extremely low birth weight infants: what is the minimum age for reliable developmental prognosis? Acta paediatrica 2007;96:342–7. [DOI] [PubMed] [Google Scholar]
- 18.Fenton TR, Kim JH. A systematic review and meta-analysis to revise the Fenton growth chart for preterm infants. BMC pediatrics 2013;13:59. [DOI] [PMC free article] [PubMed] [Google Scholar]
- 19.Smith SM, Nichols TE. Threshold-free cluster enhancement: addressing problems of smoothing, threshold dependence and localisation in cluster inference. Neuroimage 2009;44:83–98. [DOI] [PubMed] [Google Scholar]
- 20.Fonov VS, Evans AC, McKinstry RC, Almli CR, Collins D. Unbiased nonlinear average age-appropriate brain templates from birth to adulthood. Neuroimage 2009;47:S102. [Google Scholar]
- 21.Benjamini Y, Hochberg Y. Controlling the false discovery rate: a practical and powerful approach to multiple testing. J R Statis Soc B 1995;57:289–300. [Google Scholar]
- 22.Mukherjee P, Miller JH, Shimony JS, et al. Diffusion-tensor MR imaging of gray and white matter development during normal human brain maturation. AJNR American journal of neuroradiology. 2002;23:1445–56. [PMC free article] [PubMed] [Google Scholar]
- 23.Provenzale JM, Isaacson J, Chen S, Stinnett S, Liu C. Correlation of apparent diffusion coefficient and fractional anisotropy values in the developing infant brain. AJR am J Roentgenol 2010;195:W456–W62. [DOI] [PMC free article] [PubMed] [Google Scholar]
- 24.Balakrishnan U, Amboiram P, Ninan B, Chandrasekharan A, Rangaswamy R, Subramanian L. MRI at term equivalent age for predicting long-term neurodevelopmental outcome in preterm infants - a cohort study. J Mater Fetal Neonatal Med 2020;33:1867–73. [DOI] [PubMed] [Google Scholar]
- 25.Brouwer MJ, Kersbergen KJ, van Kooij BJM, et al. Preterm brain injury on term-equivalent age MRI in relation to perinatal factors and neurodevelopmental outcome at two years. PLoS One. 2017;12:e0177128. [DOI] [PMC free article] [PubMed] [Google Scholar]
- 26.Rose J, Mirmiran M, Butler EE, et al. Neonatal microstructural development of the internal capsule on diffusion tensor imaging correlates with severity of gait and motor deficits. Dev Med Child Neurol 2007;49:745–50. [DOI] [PubMed] [Google Scholar]
- 27.Skranes J, Vangberg TR, Kulseng S, et al. Clinical findings and white matter abnormalities seen on diffusion tensor imaging in adolescents with very low birth weight. Brain 2007;130:654–66. [DOI] [PubMed] [Google Scholar]
- 28.Novak I, Morgan C, Adde L, Blackman et al. Early, Accurate diagnosis and early intervention in Cerebral Palsy: advances in diagnosis and treatment. JAMA Pediatr 2017;171:897–907. [DOI] [PMC free article] [PubMed] [Google Scholar]
- 29.Hack M, Klein NK, Taylor HG. Long-term developmental outcomes of low birth weight infants. Future Child 1995:176–96. [PubMed] [Google Scholar]
- 30.Lugli L, Pugliese M, Plessi C, et al. Neuroprem: the Neuro-developmental outcome of very low birth weight infants in an Italian region. Ital J Pediatr 2020;46:26. [DOI] [PMC free article] [PubMed] [Google Scholar]
- 31.Lepomäki V, Paavilainen T, Matomäki J, et al. Effect of antenatal growth and prematurity on brain white matter: diffusion tensor study. Pediatr Radiol 2012;42:692–8. [DOI] [PubMed] [Google Scholar]
- 32.Constable RT, Ment LR, Vohr BR, et al. Prematurely born children demonstrate white matter microstructural differences at 12 years of age, relative to term control subjects: an investigation of group and gender effects. Pediatrics 2008;121:306–16. [DOI] [PubMed] [Google Scholar]
- 33.Hollund IMH, Olsen A, Skranes J, et al. White matter alterations and their associations with motor function in young adults born preterm with very low birth weight. Neuroimage Clin 2018;17:241–50. [DOI] [PMC free article] [PubMed] [Google Scholar]
- 34.Skranes J, Lohaugen GC, Martinussen M, Indredavik MS, Dale AM, Haraldseth O, Vangberg TR, Brubakk A-M. White matter abnormalities and executive function in children with very low birth weight. Neuroreport 2009;20:263–6. [DOI] [PubMed] [Google Scholar]
- 35.Vassar R, Schadl K, Cahill-Rowley K, Yeom K, Stevenson D, Rose J. Neonatal brain microstructure and machine-learning-based prediction of early language development in children born very preterm. Pediat Neurol 2020;108:86–92. [DOI] [PubMed] [Google Scholar]
- 36.Eikenes L, Løhaugen GC, Brubakk A-M, Skranes J, Håberg AK. Young adults born preterm with very low birth weight demonstrate widespread white matter alterations on brain DTI. Neuroimage 2011;54:1774–85. [DOI] [PubMed] [Google Scholar]
- 37.Pascoe MJ, Melzer TR, Horwood LJ, Woodward LJ, Darlow BA. Altered grey matter volume, perfusion and white matter integrity in very low birthweight adults. Neuroimage Clin 2019;22:101780. [DOI] [PMC free article] [PubMed] [Google Scholar]
- 38.Jin C, Li Y, Li X, et al. Associations of gestational age and birth anthropometric indicators with brain white matter maturation in full-term neonates. Hum Brain Mapp 2019;40:3620–30. [DOI] [PMC free article] [PubMed] [Google Scholar]
- 39.Franz AR, Pohlandt F, Bode H, et al. Intrauterine, early neonatal, and postdischarge growth and neurodevelopmental outcome at 5.4 years in extremely preterm infants after intensive neonatal nutritional support. Pediatrics 2009;123:e101–9. [DOI] [PubMed] [Google Scholar]
- 40.Vinall J, Grunau RE, Brant R, et al. Slower postnatal growth is associated with delayed cerebral cortical maturation in preterm newborns. Sci Trans Med 2013;5:168ra8. [DOI] [PubMed] [Google Scholar]
- 41.Pogribna U, Yu X, Burson K, Zhou Y, et al. Perinatal clinical antecedents of white matter microstructural abnormalities on diffusion tensor imaging in extremely preterm infants. Plos One 2013;8:e72974. [DOI] [PMC free article] [PubMed] [Google Scholar]
- 42.Strømmen K, Blakstad EW, Moltu SJ, et al. Enhanced nutrient supply to very low birth weight infants is associated with improved white matter maturation and head growth. Neonatology 2015;107:68–75. [DOI] [PubMed] [Google Scholar]
- 43.Sato J, Vandewouw MM, Bando N, et al. Early nutrition and white matter microstructure in children born very low birth weight. Brain Commun 2021;3:fcab066. [DOI] [PMC free article] [PubMed] [Google Scholar]