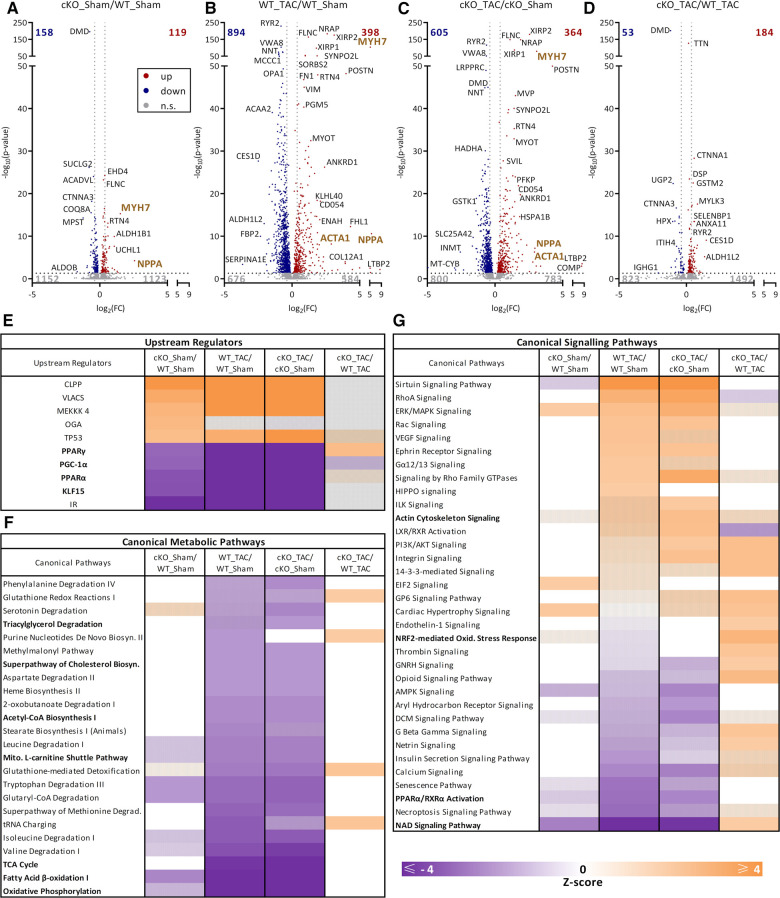
Figure 7.
Proteome analysis of hearts from cKO and WT mice in pressure overload-induced HFrEF. (A–D) Volcano plots of protein ratios comparing WT Sham, WT TAC, cKO Sham, and cKO TAC as indicated. The number of differentially regulated proteins (DRP) is indicated in the graphs. Proteins that occur at significantly higher (red, q-value ≤ 0.05) or lower levels (blue, q-value ≤ 0.05) or do not change in abundance [gray, not significant (n.s.)] are indicated. Results of QIAGEN Ingenuity Pathway Analysis (IPA). (E) TOP 5 activated and inhibited “upstream regulators”, (F) canonical metabolic pathways and (G) canonical signaling pathways with significant enrichment of regulated proteins are shown. Data are presented as heat map (q-value ≤ 0.05). A positive z-score (≥2) predicts activation (orange), a negative z-score (≤−2) predicts inhibition (purple) of the identified proteins or pathways. Hatched marked areas are not significantly activated or inhibited.

