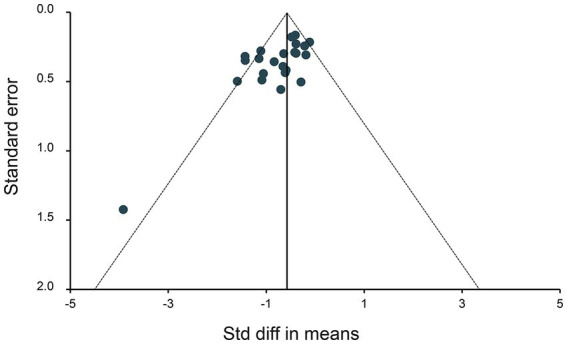
Figure 8.

Funnel plot assessing publication bias. Data points represent individual studies. The y-axis represents the measurement of study precision (plotted as the standard error of effect size), while the x-axis represents the Std difference in means for each study. Dashed triangular lines represent the region in which 95% of studies are expected to fall in the absence of bias and heterogeneity.
