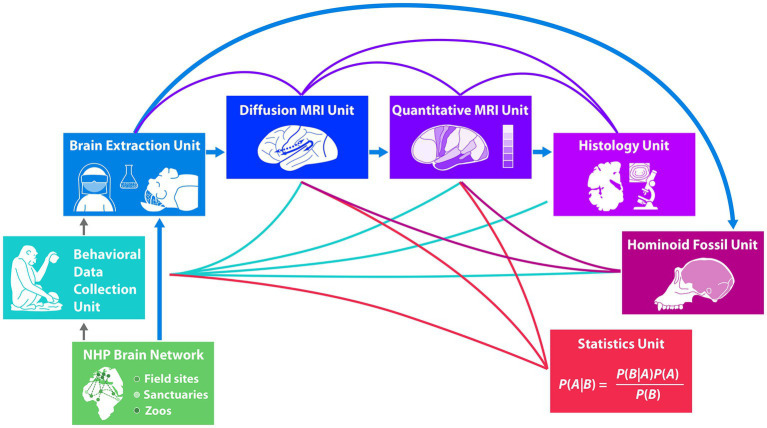
Figure 1.
The boxes in this figure represent the different habitat sites of the animals (green flat boxes) and the different units of experts working in the project from in vivo behavior (turquoise box) before brain extraction (blue box) to post mortem macro-, micro-structural and histological analyses of the brain (dark blue to purple boxes) and to analysis of the endocast (dark purple box). The strong blue arrows indicate the transition of the brains after extraction to the respective brain analysis units in a sequential order and the animals’ skulls to the hominoid fossil unit. Green lines indicate possible correlations of in vivo behavioral data with post mortem brain analysis data. Purple lines indicate correlations between different brain structural analyses. Dark purple lines to the hominoid fossil unit (dark purple box) indicate correlations between gyral structure of the brain and the skull shape. The statistical unit (red box) provides methods to allow analyses of predictions under the condition of missing data points in the respective measurements which are based on input from the behavioral unit and from the brain analysis units, indicated by red lines.

