Figure 5.
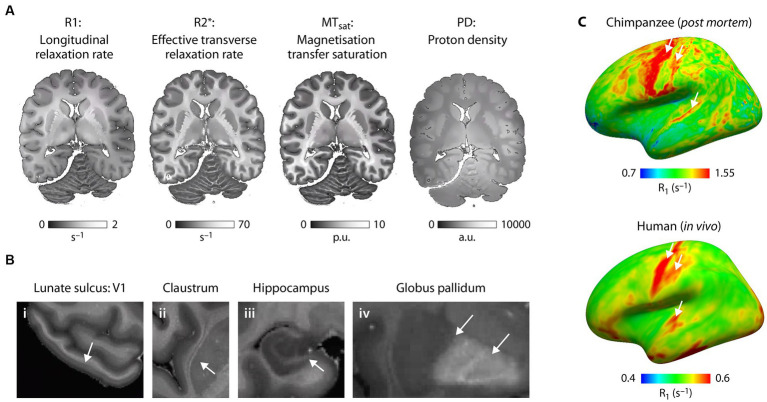
Microstructural mapping of a chimpanzee brain using quantitative MRI. (A) The quantitative MRI parameters R1, R2*, MTsat and PD acquired at 7 T and ultra-high resolution are shown for the same axial slice of one post mortem chimpanzee brain (wild, male, 45 years.). All parameters show exquisite contrast between gray and white matter and are sensitive biomarkers of brain tissue microstructure including brain myelination and brain iron content. (B) The high resolution multimodal maps allow for comprehensive characterization of brain anatomy resolving smallest neuroanatomical features including (i) layers within the cortex (arrow indicates the highly myelinated Stria of Gennari in the primary visual cortex in the lunate sulcus), (ii) thin gray matter structures such as the claustrum, (iii) substructures within the hippocampus and (iv) iron accumulation in subcortical structures. (C) Whole brain quantitative MRI maps allow for mapping of myeloarchitecture across the entire brain facilitating quantitative comparison of brain organization across species. R1 sampled at middle cortical depth and mapped across the neocortex for (bottom panel) one post mortem chimpanzee brain (captive, female, 44 years.) reflect different myelination of brain areas (highly myelinated motor, sensory and auditory cortex indicated with arrows) and can be compared with the same metric obtained in (right panel) humans in vivo (Kirilina et al., 2020). Note that absolute R1 values are larger due to fixation of the post mortem brain tissue compared to in vivo.

