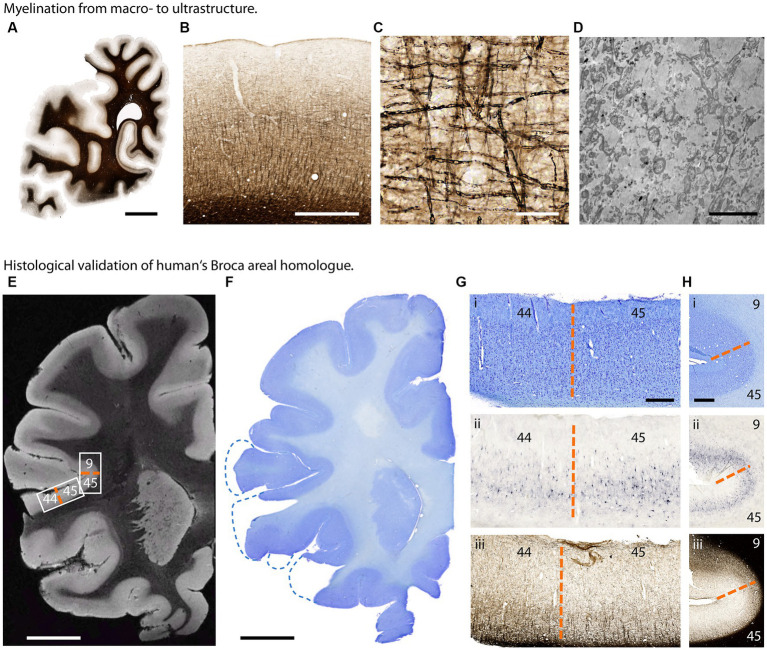
Figure 6.
Histological investigation of great ape brain samples. (A–D) Myelination from macro- to ultrastructure in a chimpanzee brain. (A) Section of one hemisphere illustrating myelin distribution (Gallyas silver stain). (B) Cortical myelination profile (Gallyas). (C) Cortical myelinated fibers in detail (Gallyas). (D) Myelinated axons in electron microscopy. Scalebars: (A) 10 mm, (B) 1 mm, (C) 50 μm, (D) 5 μm. (E–H) Histological validation of human’s Broca areal homolog in a bonobo brain. (E) T2*-weighted MR image acquired at 50 μm isotropic resolution. Low intracortical myelination in areas BA 44 and 45 results in higher image intensity. (F) Corresponding Nissl stained section. (G) Border between Brodmann area 44 and 45 homologs (dashed orange line) in (i) Nissl stain for cytoarchitecture, (ii) Aggrecan stain for neuronal extracellular matrix and (iii) Gallyas silver stain for myelin. (H) Border between Brodmann areas 45 and 9 homologs (dashed orange line) in (i) Nissl, (ii) Aggrecan and (iii) Gallyas. Scalebars: (E,F) 10 mm, (G) 1 mm, (H) 500 μm.

