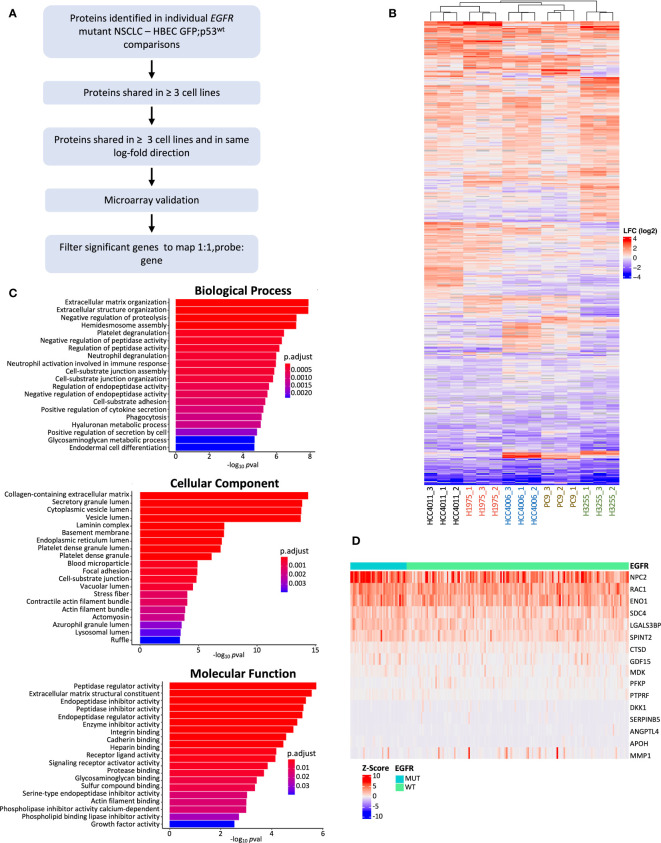
Figure 3.
Individual EGFR mutant NSCLC cell line comparison against HBEC GFP;p53wt and filtering pipeline. (A) Filtering pipeline used to identify protein candidates for biomarker validation. Differentially expressed proteins from cell line comparisons with HBEC GFP;p53wt (p adj< 0.05, absolute LFC > 0.6) were determined, and filtered for microarray gene expression validation if found in 3 or more EGFR mutant cell line comparisons and LFC expression was in the same direction (LFC values were all positive or negative). Filtered differentially expressed proteins were analyzed for differential gene expression with Z-score normalized Affymetrix gene expression data from 199 primary LUAD tumors (45), and differentially expressed genes that were found to be significant (p adj< 0.05, Benjamini-Hochberg adjustment) were further filtered for optimal 1:1 probe to gene mapping for additional stringency (47). (B) Heatmap of differentially expressed genes found from individual comparison between EGFR mutant NSCLC cell lines and HBEC GFP;p53wt (cell line and protein, hierarchical clustering; cell line clustering distance, complete; protein clustering distance, average). LFC ranges from high (red) to low (blue). (C) Bar plots showing the top 20 GO enrichment terms sorted by adjusted p-value (p adj< 0.05, Benjamini-Hochberg adjustment) for biological processes, molecular functions, and cellular components for differentially expressed proteins found during individual cell line comparisons between EGFR mutant NSCLC cell lines and HBEC GFP;p53wt. (D) Heatmap of differentially expressed genes post-microarray analysis for further validation (p adj< 0.05). Samples are grouped by EGFR status (mutant, wild type) (gene clustering method, Euclidean; gene clustering distance, complete).

