Figure 1.
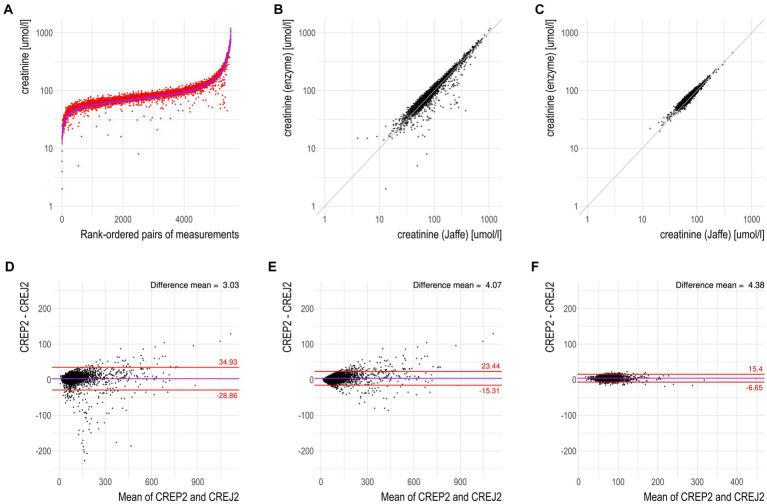
CREP2 exhibits a strong susceptibility to underestimate creatinine concentrations in the “hospital adult urgent care population” in contrast to the “common adult population.” (A) Logarithmic-scale scatterplot with paired data for the dataset “hospital adult urgent care population” with the samples being rank-ordered by creatinine concentrations determined by the CREJ2 method. The data show that CREP2 values were much lower than CREJ2 values in approximately 2% of the samples. (B) Logarithmic-scale scatterplot with identity line for the same dataset as in panel (A). The identity line represents perfect agreement between the two methods; no negative interferences in the urgent care cohort with the CREJ2 method were observed. (C) Logarithmic-scale scatterplot with identity line for the dataset “common adult population” showing agreement between the two methods. (D) Bland–Altman plot for dataset “hospital adult urgent care population” from panel (A); the horizontal solid line represents the mean difference between the two values, whereas the red (dotted) lines represent the limits of agreement (1.96 SD) of individual differences. (E) Bland–Altman plot for the same dataset as in panel (D) where outlying observations greater than 25% were removed. (F) Bland–Altman plot for dataset “common adult population” where no deviations between the two methods in the general community patient cohort were observed.

