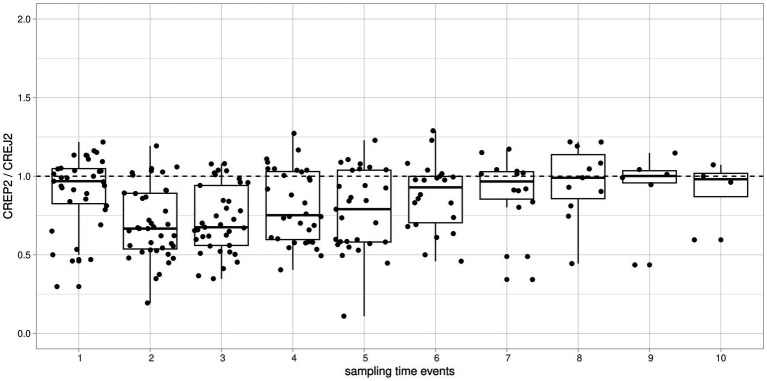
Figure 3.
Time-dependent individual patient trends of consecutive creatinine measurements expressed as CREP2/CREJ2 ratio and aggregated and ranked to “sampling time events” from the first event through the tenth event. To visualize individual time-dependent trends of ratios of creatinine concentrations, we used relative timescale aggregating measurements as ordinal data. Boxplots of all patients/all measurements showed as “sampling time events 1 through 10” on the x-axis against the ratio of creatinine concentrations by CREP2/CREJ2 are shown. Major deviations from the median line observed among the 2nd through 7th measurement events implying a drug effect present but then returning to result concordance showed as a ratio approximately 1 implying a drug effect being “washed out.”

