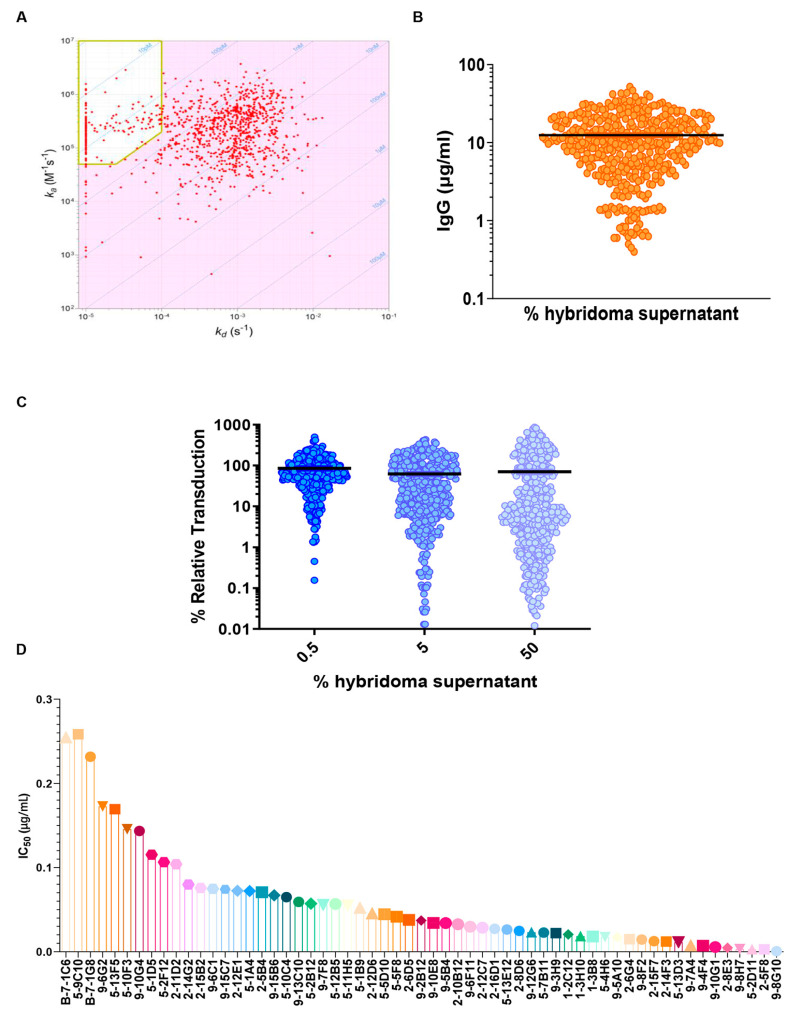
Figure 2.
Massive characterization of huge panel of hybridoma supernatants. (A) Iso-affinity plot of hybridomas at a single dilution to evaluate the ka and kd. In the yellow box, the selected antibodies have better binding (affinity < 380 pM, displaying a kd <1 × 10⁻⁴s−1 and a ka >5 × 10⁴ M−1s−1). (B) Total IgG amount for each analyzed sample (mg/mL) using Octet RED96 system (ForteBio). (C) VSV(Fluc_eGFP)-CoV2-PP pseudovirus assay using SARS-CoV-2 Wuhan variant. All hybridoma supernatants were screened in duplicates, with 3 concentration steps to evaluate their neutralization properties. (D) Obtained IC50 values for pseudovirus assay; the obtained values swing between 0.01 µg/mL to a maximum value of 0.25 µg/mL.

