
Figure 5. Epitope mapping of vaccine-elicited antibody responses.
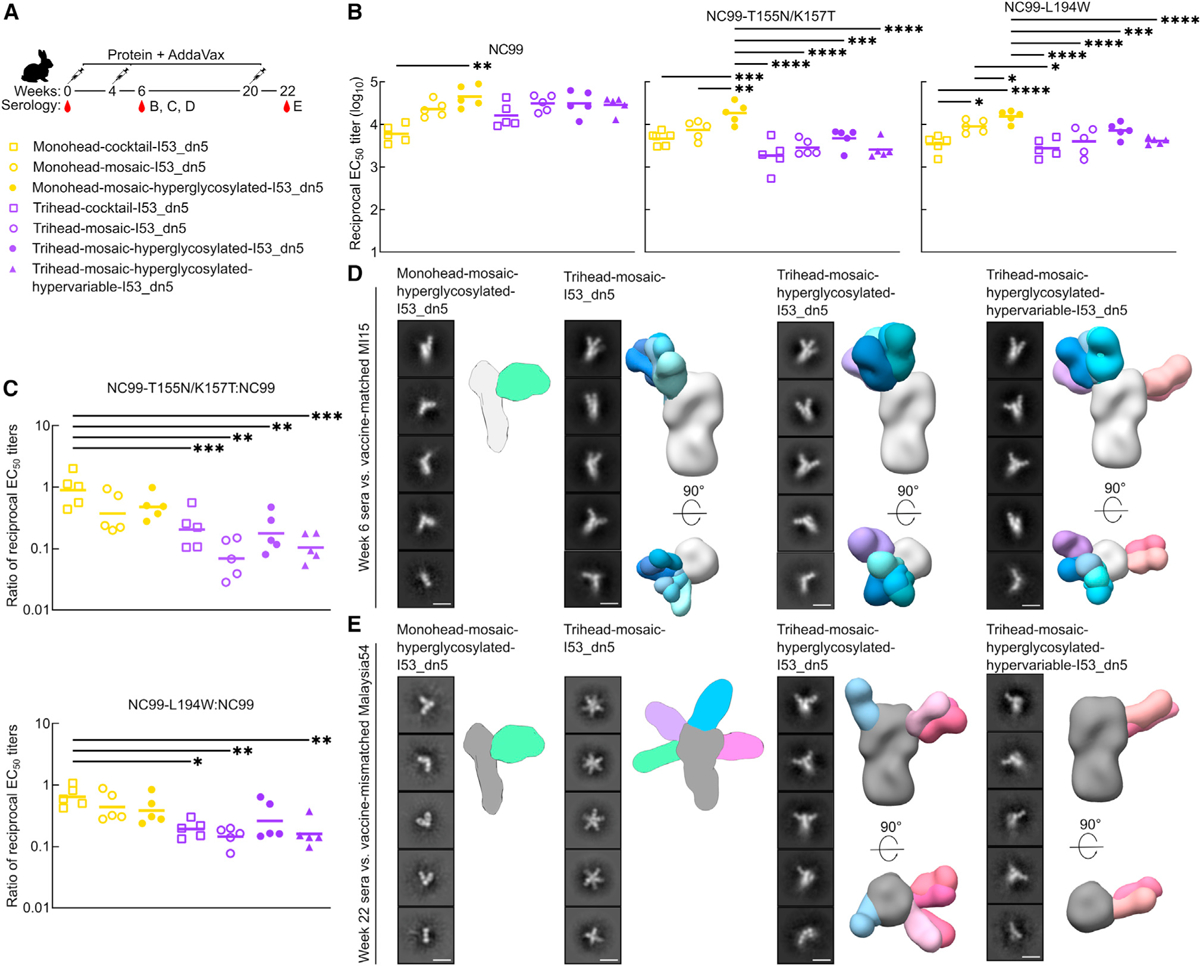
(A) Hypervariable trihead nanoparticle rabbit immunization schedule and groups.
(B) ELISAs using NC99 probes against week 6 rabbit study serum. NC99 ELISA is the same as in Figure 4B. Each symbol represents an individual animal, and the geometric mean of each group is indicated by the bar (n = 5 rabbits/group).
(C) Ratio of NC99 probes to NC99 binding titers in (B).
(D) Representative 2D class averages of week 6 serum from four groups in rabbit study against strain-matched MI15. Hyperglycosylated monohead group has a cartoon schematic of a likely 3D model, while all other groups are composite 3D models of ns-EMPEM analysis.
(E) Representative 2D class averages of week 22 serum from four groups in rabbit study against strain-mismatched Malaysia54. Hyperglycosylated monohead and mosaic trihead groups have a cartoon schematic of their likely 3D models, while other groups are composite 3D models of ns-EMPEM analysis. Scale bars: 15 nm.
Statistical significance was determined using one-way ANOVA with Tukey’s multiple comparisons test; *p < 0.05; **p < 0.01; ***p < 0.001; ****p < 0.0001.