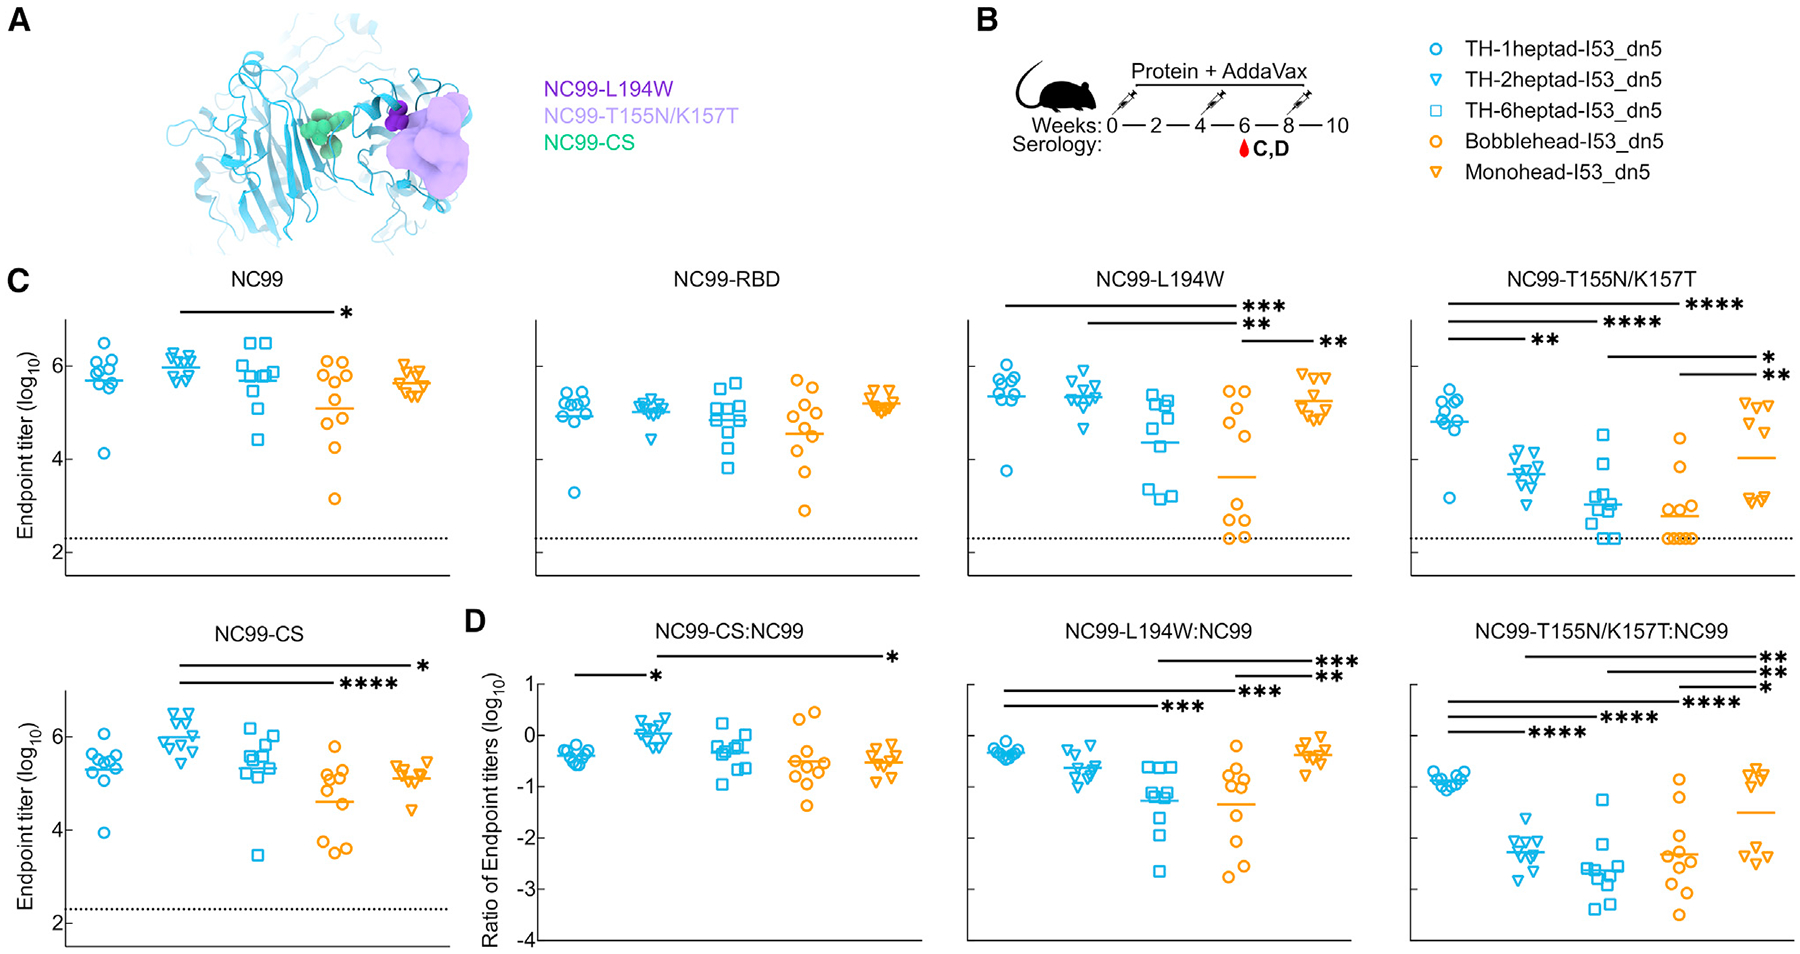
Figure 5. Epitope mapping of vaccine-elicited antibodies.

(A) Structural schematic of NC99 probes. Sphere representations show mutated residues. For NC99-T155N/K157T, the density of a modeled glycan is shown.
(B) Mouse immunization schedule and groups for adjuvanted trihead nanoparticle extension series.
(C) ELISA binding titers against various NC99 probes in week 6 adjuvanted immune sera.
(D) Ratios of ELISA binding titers of mutated NC99 probes to NC99 in (B).
Each symbol represents an individual animal, and the geometric mean of each group is indicated by the bar (n = 9–10 mice/group). Statistical significance was determined using one-way ANOVA with Tukey’s multiple comparisons test; *p < 0.05; **p < 0.01; ***p < 0.001; ****p < 0.0001.
