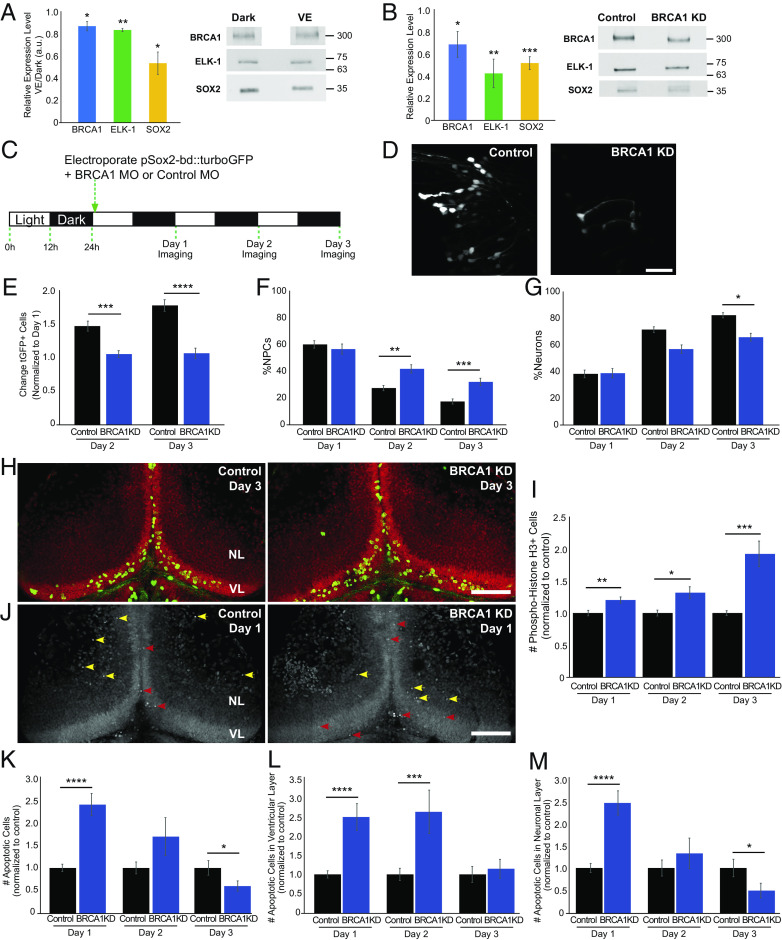
Fig. 4.
BRCA1 regulates neural progenitor cell fate. (A) BRCA1 (blue), ELK-1 (green), and SOX2 (yellow) expression are increased in animals maintained in the dark compared to enhanced visual experience (VE). Quantitation, normalized to Ponceau staining (Left). n: BRCA1 (5); ELK-1 (4), SOX2 (4). (B) BRCA1 knockdown lowers BRCA1 (blue, n = 5), ELK-1 (green, n = 6), and SOX2 (yellow, n = 6) protein expression. Midbrains were dissected for western blots 2 d after electroporating morpholinos. (C) Diagram of in vivo imaging protocol. Animals were maintained in a 12 h light/12 h dark cycle. After coelectroporation with tGFP and brca1 or control morpholinos, animals were imaged for 3 consecutive days. (D) Representative in vivo images of tGFP+ tectal cells from control morpholino and BRCA1 KD animals. (Scale bar, 50 µm.) (E) BRCA1 KD significantly reduced tGFP+ cell numbers compared to control morpholino-treated animals on days 2 and 3. n = 45 to 46 animals per condition. (F and G) Of the cells shown in (E), the percentage of NPCs significantly increased (F) and neurons decreased (G) with BRCA1 KD compared to control morpholino treatment. (H) Z-projection images showing pH3 immunolabeling (green) and SYTOX nuclear labeling (red) on day 3 in the ventricular layer (VL) and neuronal layer (NL). (Scale bar: 100 µm.) (I) BRCA1 KD significantly increased the total number of pH3+ cells in the tectum compared to control morpholino-treated animals over 3 d. n = 37 to 48 animals per group/timepoint. (J) Confocal Z-projection images of SYTOX-labeled apoptotic nuclei in NPCs in the ventricular layer on day 1 (VL, red arrowheads) and apoptotic neurons in the neuronal layers (NL, yellow arrowheads). (Scale bar: 100 µm.) (K) BRCA1 KD significantly affected the total number of apoptotic cells compared to control morpholino-treated animals. n = 34 to 38 animals per group/timepoint. (L and M) Of the cells shown in (K), BRCA1 KD significantly increased apoptosis in NPCs on days 1 and 2 (L) and in neurons on day 1 compared to control morpholino-treated animals. (M) *P < 0.05, **P < 0.01, ***P < 0.001, and ****P < 0.0001; two-tailed Student’s t test in (A); one-tailed Student’s t test in (B); Mann–Whitney U test in (E–G), (I), and (K–M).

