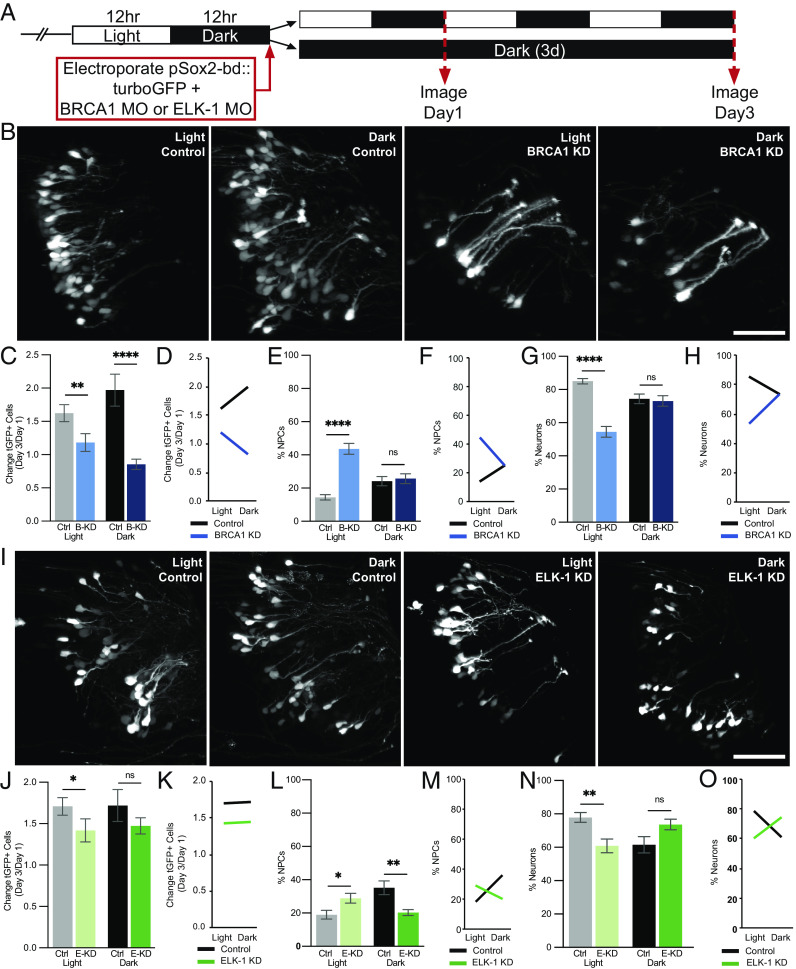
Fig. 6.
BRCA1 and ELK-1 mediate visual experience–dependent effects on neural progenitor cell fate. (A) Diagram of treatment and imaging protocol. (B–H) BRCA1 mediates the effects of visual stimulation on NPC fate. (B) Representative images of tGFP+ cells collected on day 3 from animals exposed to 12 h light/12 h dark (light) or continuous dark (dark) with BRCA1 KD or control morpholinos. (Scale bar: 50 µm.) (C–H) Quantitative analysis of imaging data. (C) BRCA1 KD (B-KD) blocked the normal increase in GFP+ cells over the 3-d imaging period in animals exposed to 12 h light/12 h dark (light: gray bar vs. light blue bar) or dark (dark: black bar vs. dark blue bar) compared to control morpholino-treated animals. n = 17 to 24 animals per condition/timepoint. (D) Profile plot of data in (C) demonstrating that the effect of visual experience on tGFP+ cell number depends on BRCA1. (E and G) BRCA KD significantly increased NPCs in animals exposed to light [(E) light: gray bar vs. light blue bar] and decreased neurons [(G) light: gray bar vs. light blue bar] compared to control morpholino-treated animals. BRCA1 KD did not affect NPCs (E) or neurons (G) in animals exposed to dark (black vs. dark blue bars). (F and H) Profile plots of data in (E) and (G) demonstrating that the effect of visual experience on NPC fate depends on BRCA1 expression. (I–O) ELK-1 mediates the effects of visual stimulation on NPC fate. (I) Representative images of tGFP+ cells collected on day 3 in animals exposed to light or dark with ELK-1 KD or control morpholinos. (Scale bar: 50 µm.) (J–O) Quantitative analysis of in vivo imaging data. (J) ELK-1 KD (E-KD) blocked the normal increase in GFP+ cells in animals exposed to light (light: gray vs. light green bars) but not dark (black vs. dark green bars) compared to control morpholino-treated animals. n = 11 to 14 animals per condition/timepoint. (K) Profile plot of factorial comparison of data in (I), demonstrates that the effect of visual experience on the total number of tGFP+ cells is not dependent on ELK-1. (L) ELK-1 KD significantly increased NPCs under light conditions (gray vs. light green bars) and significantly decreased neural progenitors under dark conditions (black vs. dark green bars) compared to control morpholino-treated animals. (N) ELK-1 KD significantly decreased neurons in animals exposed to light (gray vs. light green bars) but did not significantly affect neurons in animals in dark (black vs. dark green bars) compared to control morpholino-treated animals. (M and O) Profile plots of data in (L) and (N) demonstrate that the effect of visual experience conditions on the fate of NPCs and neurons depends on ELK-1 expression. *P < 0.05, **P < 0.01, ***P < 0.001, and ****P < 0.0001; Mann–Whitney U test in (C), (E), (G), (J), (L), and (N). Two-way ANOVA analysis was used in (D), (F), (H), (K), (M), and (O).

