
Fig. 1.
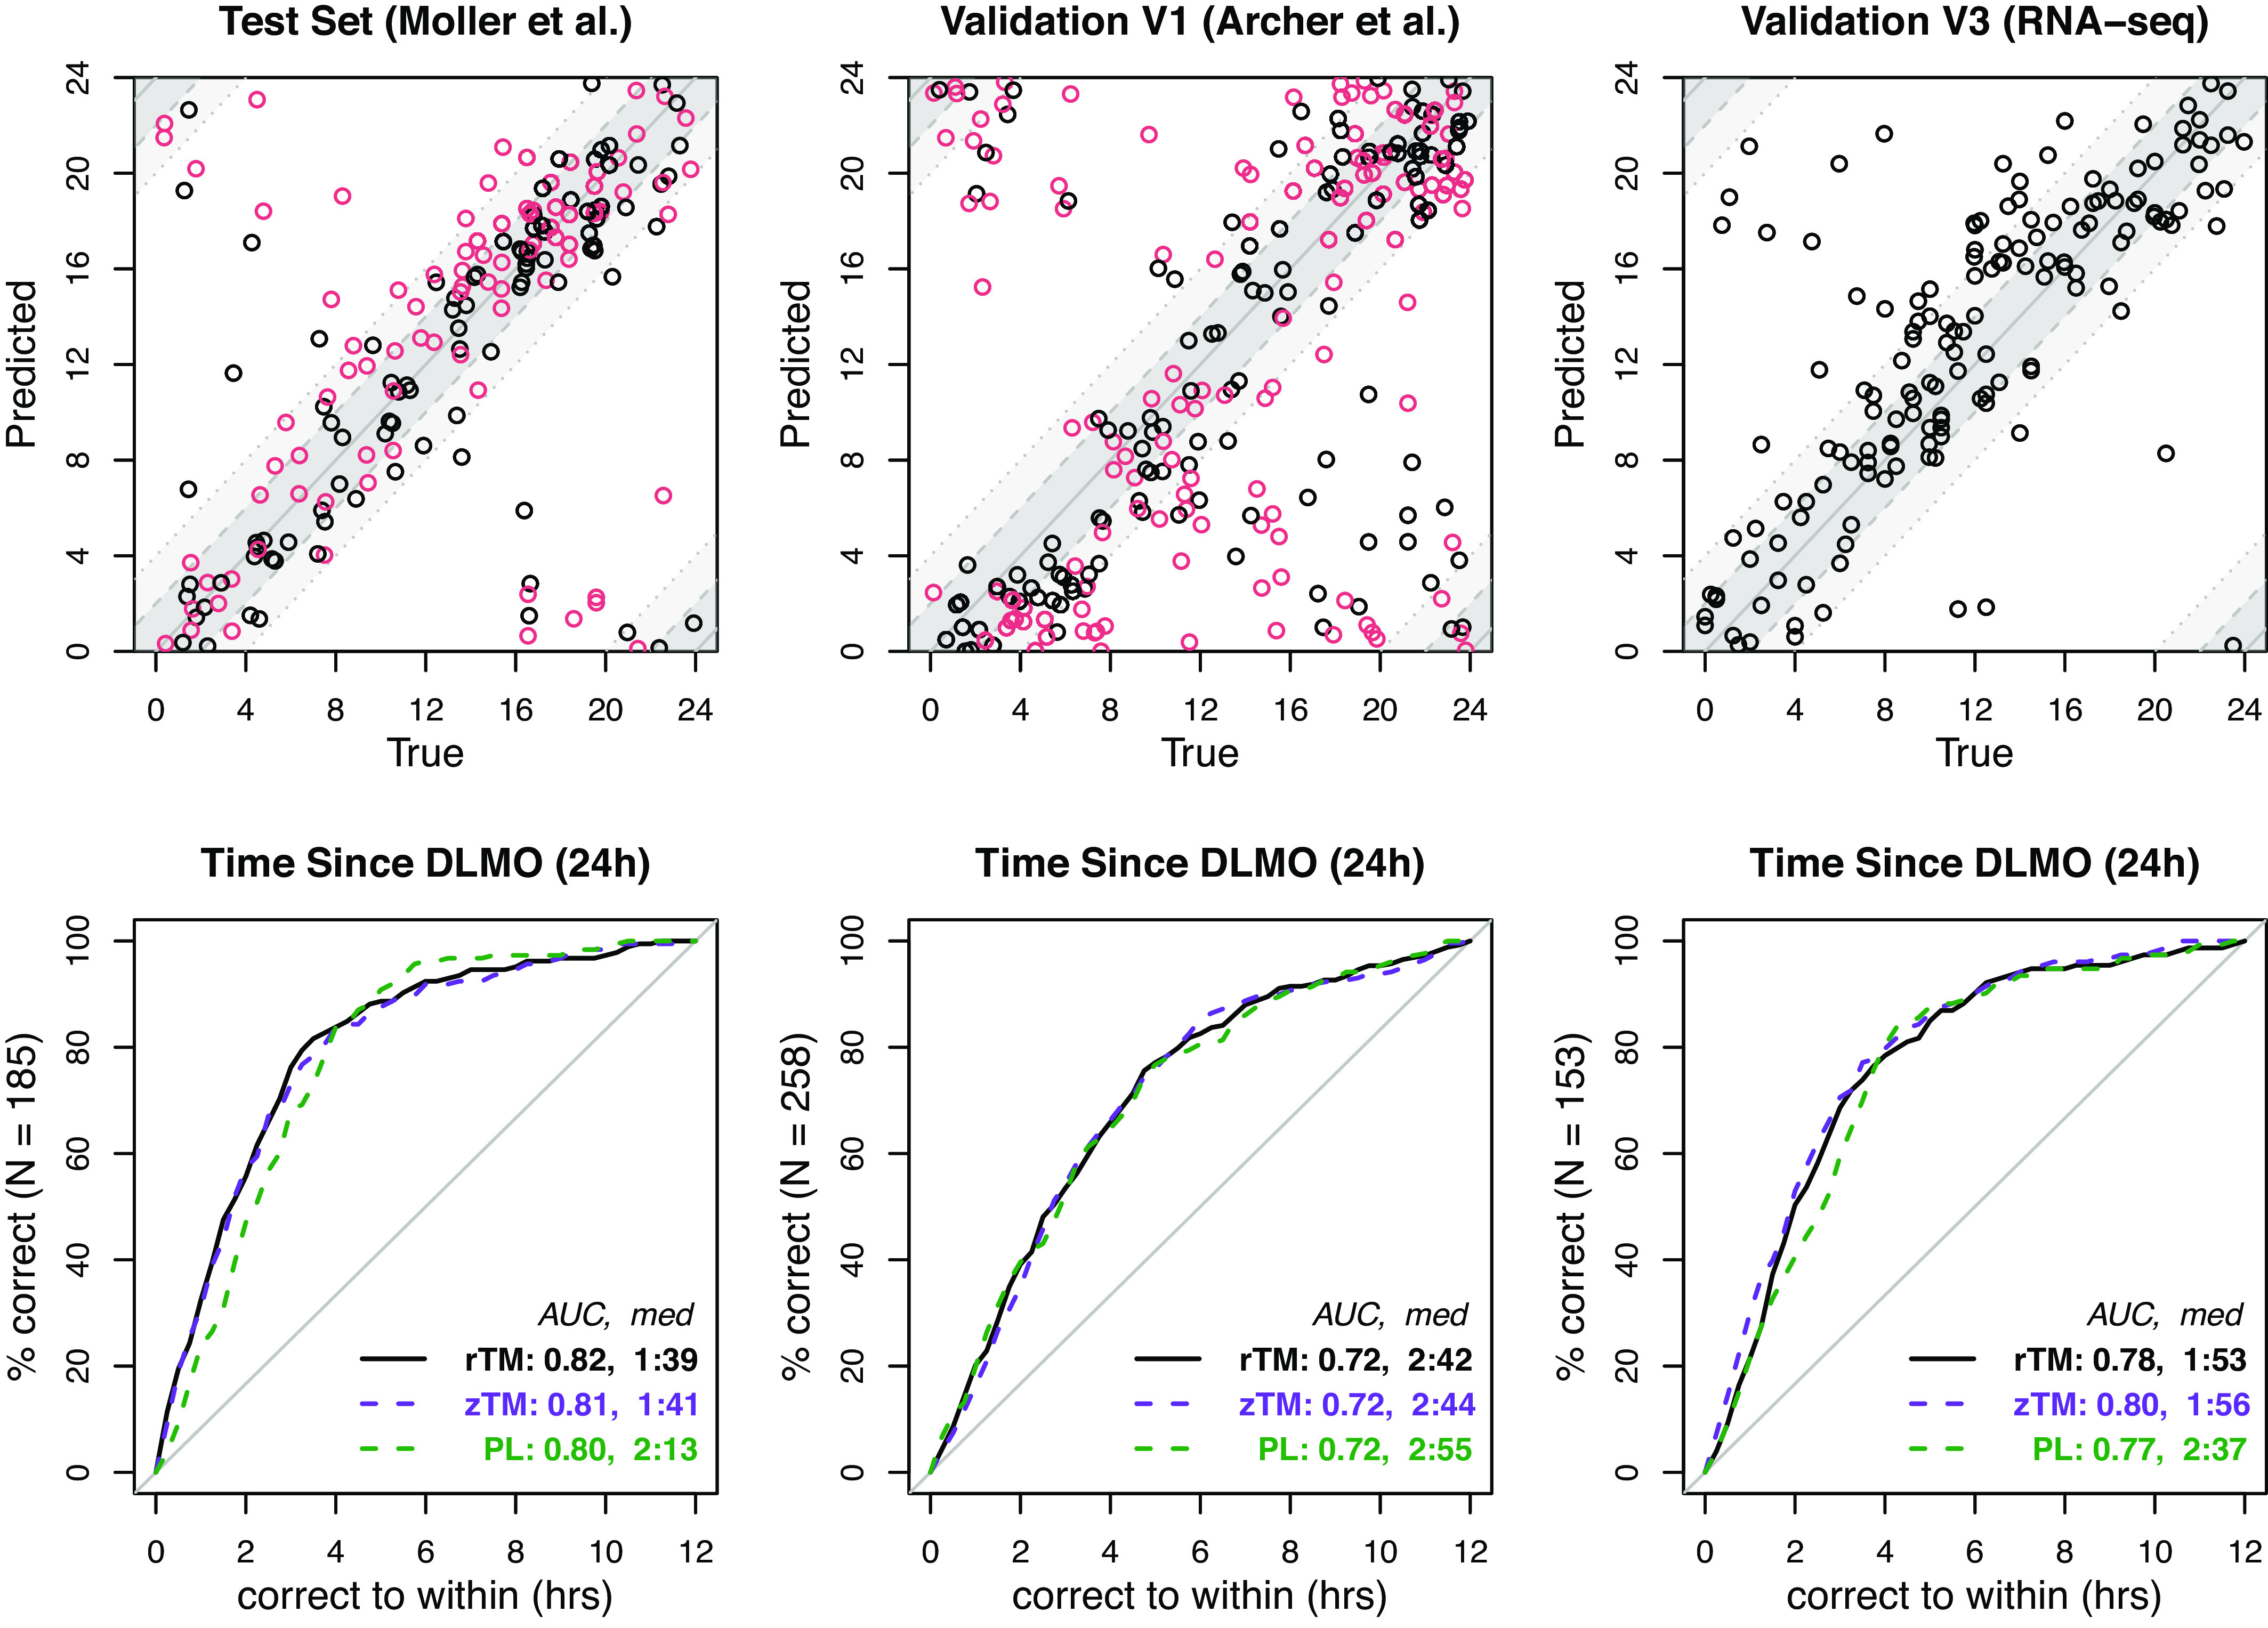
TimeMachine predictions of melatonin phase (time since DLMO) on data from three distinct studies. Both variants of the TimeMachine algorithm, ratio TimeMachine (rTM) and -score TimeMachine (zTM), were trained on a subset of subjects from the Möller et al. study (TrTe) and then applied to the remaining test subjects in Möller et al. along with two independent datasets V1 (Archer et al.) and V3 (RNA-Seq) for validation. The top row shows the agreement of predictions from ratio TimeMachine with the measured melatonin phase (time since DLMO) for each sample. Dark and light gray bands indicate an error range of 2 and 4 h. The color of the point represents experimental protocols: Black denotes control condition, and red denotes sleep restriction (Möller et al.) and forced desynchrony (Archer et al.), respectively. In the bottom row, we plot the fraction of correctly predicted samples for each study vs. prediction errors for the ratio TimeMachine algorithm (solid black), in comparison to the other variant, -score TimeMachine algorithm (dashed purple), and the single-sample PLSR algorithm (dashed green), along with the normalized area under the curves (AUC) and median absolute errors for each algorithm.