Fig. 3.
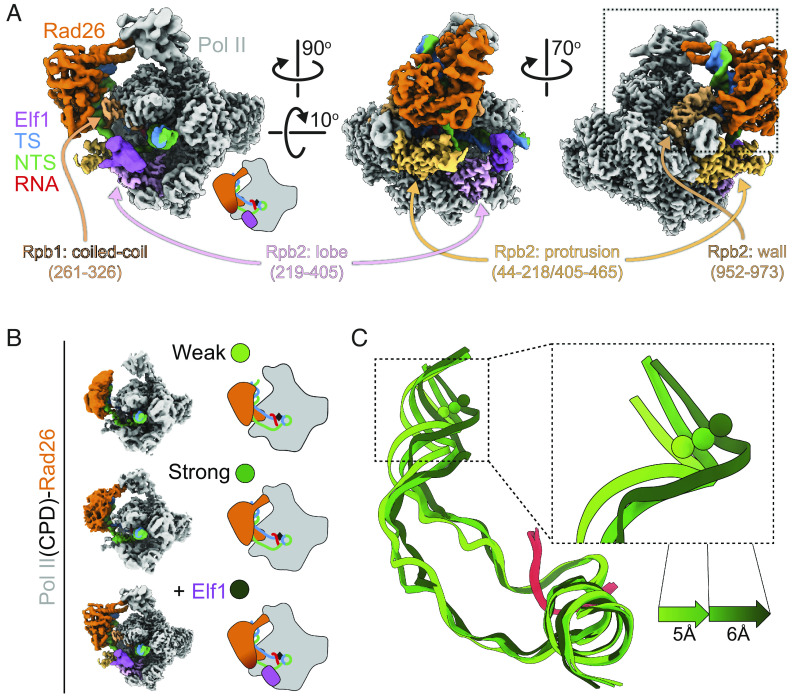
CryoEM structure of Pol II(CPD)-Rad26-Elf1 complex. (A) 3.1Å cryo-EM map of the Pol II(CPD)-Rad26-Elf1 complex, with Elf1 colored in light purple. The regions of Pol II that interact with Elf1 or Rad26 are colored in shades of purple or orange, respectively. (B, C) The increase in the bend angle of the upstream DNA mirrors the improvement of the Rad26 density in the cryo-EM maps. (B) Cartoon representations of the three structures being compared. (C) The DNA/RNA scaffolds were superimposed using the downstream DNA and color-coded as shown on the left. The shifts in the upstream DNA between these states are shown.

