
Fig. 4.
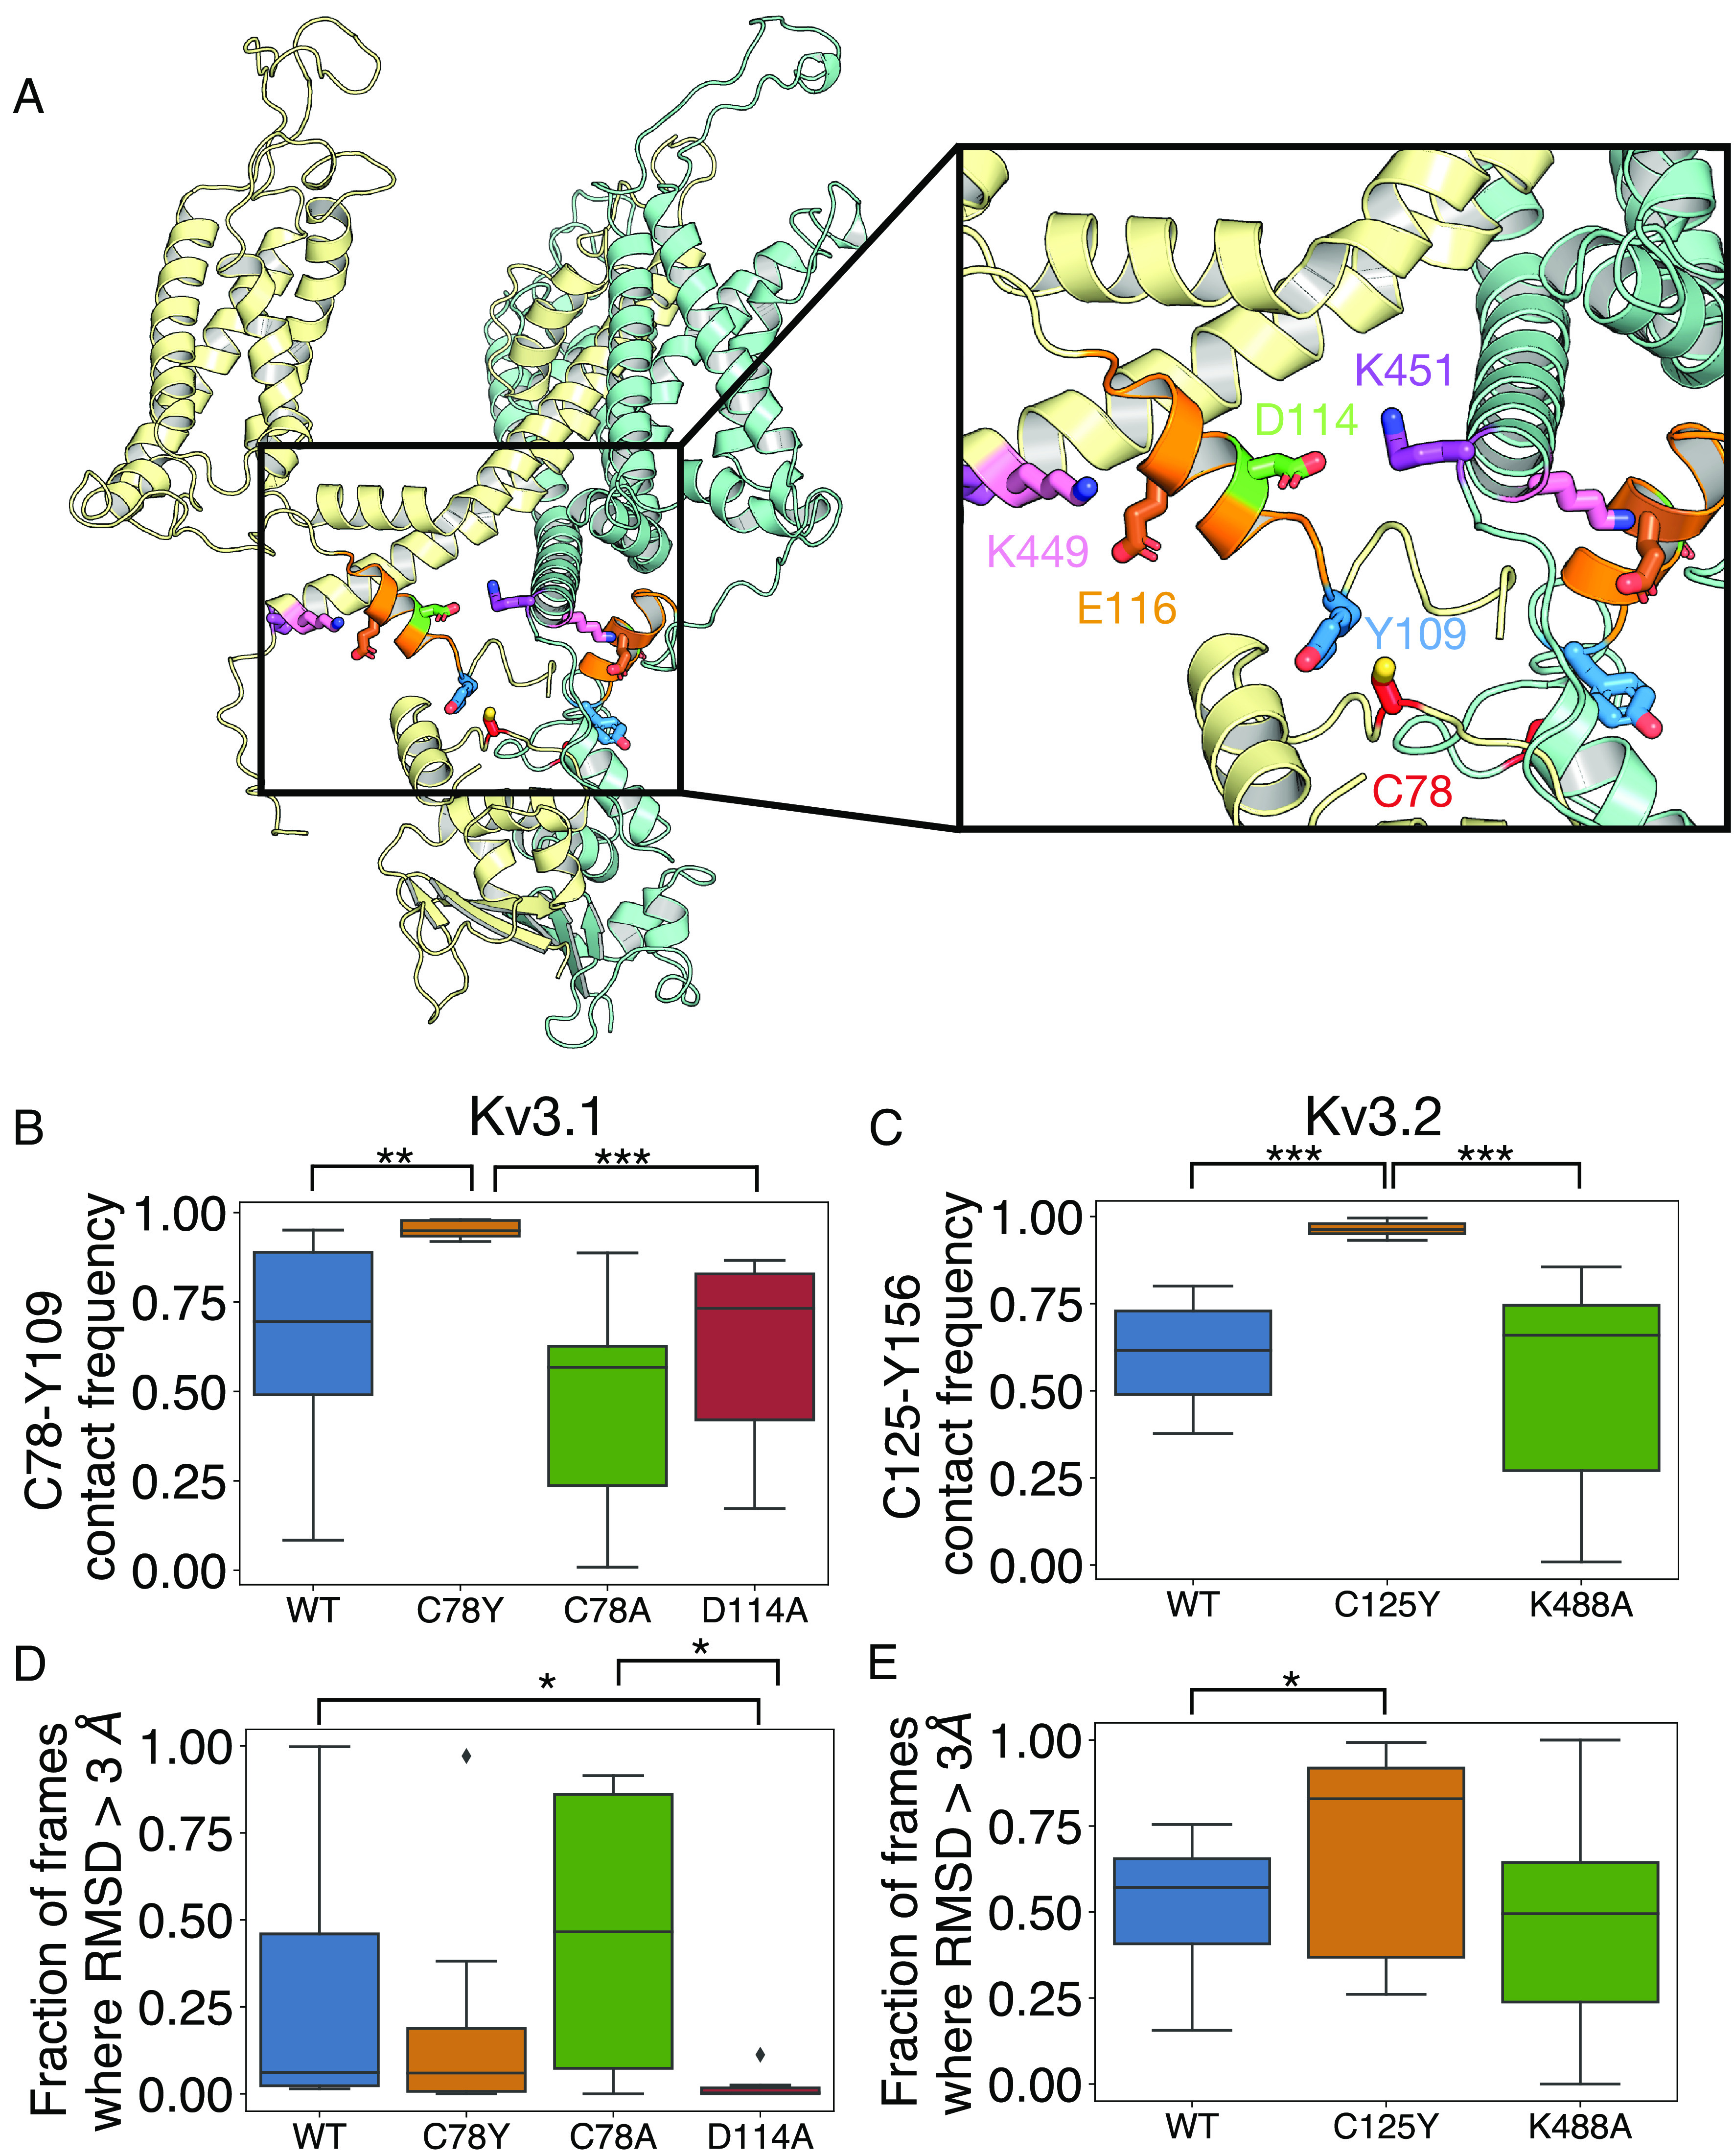
Interactions around Kv3.1-Cys78, the paralogue to Kv3.2-Cys125. (A) Shown is a cartoon representation of the structure of K3.1, with only two adjacent subunits (yellow and teal) included for clarity. Key interacting residues Cys78 (C78, red), Tyr109 (Y109, blue), Asp114 (D114, green), Glu116 (E116, brown), Lys449 (K449, pink), and Lys451 (K451, purple) are shown as sticks. The alpha-6 helical region (residues 110 to 20) is shown in orange. (B–E) Box plot representation of distributions where the box represents the interquartile range (IQR) and the whisker shows the range of data within 1.5× of the IQR. Data beyond 1.5× of the IQR are shown as the diamond. All data were collected on the last 500 ns of the simulations. (B) The fraction of frames where Cys78 (C78Y) is within 3 Å proximity to Tyr109 on Kv3.1. (C) The fraction of frames where Cys125 (C125Y) is within 3 Å proximity to Tyr156 on Kv3.2 over the last 600 ns of the simulation (n = 8). (D and E) The fraction of frames where the rmsd of the C-alpha atoms of the alpha-6 helix is greater than 3 Å. *P < 0.05; **P < 0.01; and ***P < 0.001; via the Mann–Whitney U test.