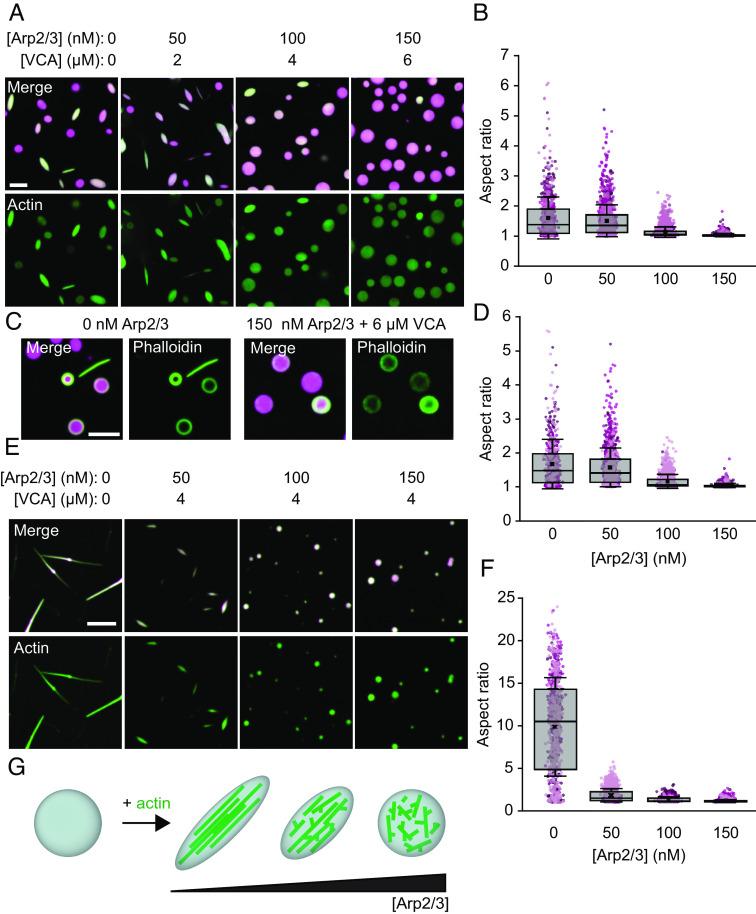
Fig. 2.
Addition of Arp2/3 and VCA to VASP droplets inhibits droplet deformation and actin bundling. (A) Representative images of droplets formed from 15 μM VASP and 2 μM actin, with increasing concentrations of Arp2/3 and VCA. (Scale bar, 5 μm.) (B) Quantification of aspect ratios of droplets in A. Box represents interquartile range (IQR) with median as a bisecting line, mean as an “x,” and whiskers, which represent SD. Each background data point represents a single droplet, and are color-coded according to the three replicates. For 0 nM Arp2/3, n = 755 droplets; for 50 nM Arp2/3, n = 1,391; for 100 nM Arp2/3, n = 2,123; for 150 nM Arp2/3, n = 2,286. (C) Representative images of phalloidin staining of 2 μM actin polymerized by either 15 μM VASP-only droplets, or 15 μM VASP droplets with 150 nM Arp2/3 and 6 μM VCA. (Scale bar, 5 μm.) (D) Quantification of aspect ratios of droplets in B, filtered for droplets with a minor axis <3 μm. For 0 nM Arp2/3, n = 653 droplets; for 50 nM Arp2/3, n = 1,105; for 100 nM Arp2/3, n = 1,232; for 150 nM Arp2/3, n = 1,040. (E) Representative images of droplets formed from 5 μM VASP, exposed to 0.67 μM actin, with 4 μM VCA and increasing concentrations of Arp2/3. (Scale bar, 5 μm.) (F) Quantification of droplet aspect ratio as a function of Arp2/3 concentration as seen in E. The box represents IQR with median as a bisecting line, mean as an x, and whiskers, which represent SD. Data from three replicates. For 0 nM Arp2/3, n = 656; for 50 nM Arp2/3, n = 1,116; for 100 nM Arp2/3, n = 1,239; for 150 nM Arp2/3, n = 1,006. (G) Cartoon depicting sphere-to-rod transition driven by the ability of VASP droplets to bundle actin filaments, a process which is inhibited by the addition of Arp2/3 and VCA.

