Fig. 3.
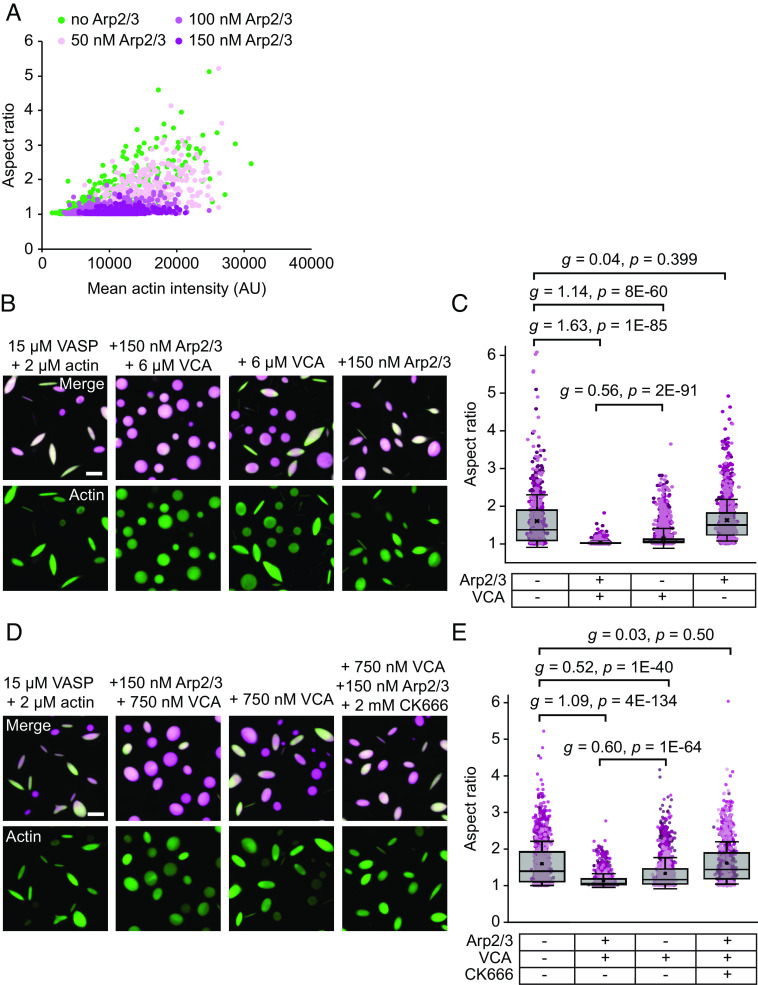
Decreased droplet deformation is due to Arp2/3 and VCA. (A) Relationship between droplet aspect ratio and actin intensity within the droplet for droplets formed from 15 μM VASP and exposed to 2 μM actin with increasing concentrations of Arp2/3 and VCA, as visualized in Fig. 2A. Replicates can be found in SI Appendix, Fig. S1. n = 2,885 droplets counted over at least three images per condition. (B) Representative images of droplets composed of 15 μM VASP and 2 μM actin, with either i) 150 nM Arp2/3 and 6 μM VCA added, ii) only VCA, or iii) only Arp2/3. (Scale bar, 5 μm.) (C) Quantification of droplet aspect ratio measured from B. Box represents IQR with median as a bisecting line, mean as an x, and whiskers represent SD. Data points are color-coded according to three independent replicates. At least 700 droplets were analyzed per condition. Brackets show data tested for effect size using Hedges' g, and significance using an unpaired two-tailed t-test. (D) Representative images of droplets composed of 15 μM VASP and 2 μM actin, with either i) 150 nM Arp2/3 and 750 nM VCA added, ii) only VCA, or iii) Arp2/3, VCA, and the Arp2/3 inhibitor, CK666. (Scale bar, 5 μm.) (E) Quantification of droplet aspect ratio measured from D. The box represents IQR with median as a bisecting line, mean as an x, and whiskers represent SD. Data points are color-coded according to three independent replicates. At least 1,000 droplets were analyzed per condition. Brackets show data tested for effect size using Hedges' g, and significance using an unpaired two-tailed t-test.

