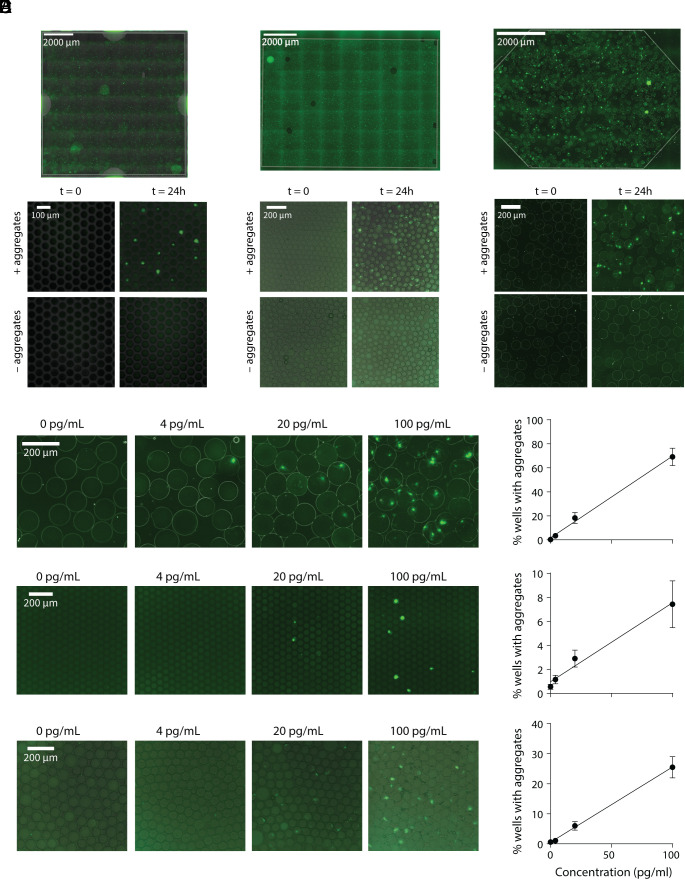
Fig. 2.
α-synuclein aggregate growth in microcompartments. Representative images of microwells (A), droplets (B), and hydrogel microcapsules (C) at t = 0 and t = 24 h of the SAA reaction with and without pre-formed filaments, + and – aggregates, respectively. The entire imaging area is shown on the Top for the microwell array and droplets or microcapsules loaded into parking lot devices. Displayed by decreasing sensitivity, images of alginate microcapsules (D), microwells (E), and droplets (F) for reaction seed concentrations ranging from 0 to 100 pg/mL. To the Right, the percent of wells with growing aggregates is shown vs. the concentrations of pre-formed filaments used as reaction seeds, which demonstrates the quantitative nature of all three assay formats.

