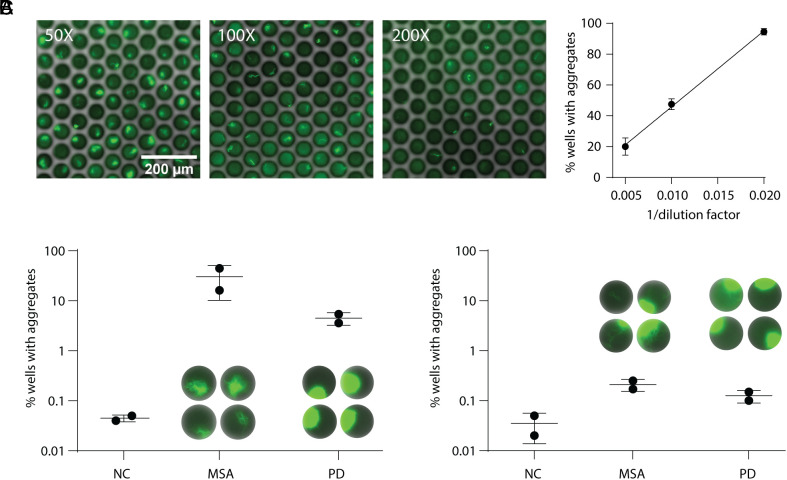
Fig. 3.
Analysis of clinical samples with digital SAA. (A) Representative images acquired after analyzing different dilutions of MSA brain lysate using the microwell SAA. On the Right, the percent of wells with detectable aggregates vs. one over the lysate dilution factor is shown. Below, the percentage of wells with growing aggregates is shown for NC, MSA, and PD brain lysate (B) and CSF (C) samples. Exemplary images of the aggregate structures are shown for the MSA and PD samples.

