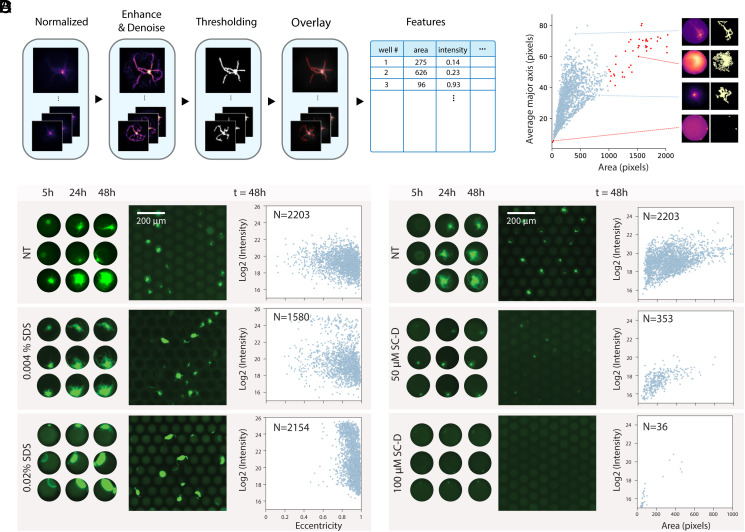
Fig. 5.
Characterizing aggregate growth in the presence of small inhibitor molecules. (A) Schematic outlining the image analysis pipeline used to extract aggregate features. (B) Average major axis plotted vs. the area for each aggregate detected, highlighting the skeleton lines extracted from four individual wells. Correctly identified aggregates are shown in blue, and outliers that arise due to background noise are shown in red. (C) Representative images of aggregates growing in the absence (NT) and in the presence of two concentrations of SDS (0.004% and 0.02%). On the Left, the growth of three single aggregates over time is shown and on the Right, log2 of the intensity vs. the eccentricity of all detected aggregates is displayed for each condition. (D) Example images of aggregates amplified in the absence (NT) and presence of SC-D at two concentrations (50 µM and 100 µM). Single aggregates growing over time are shown on the Left and log2 of the intensity is plotted vs. area on the Right.

