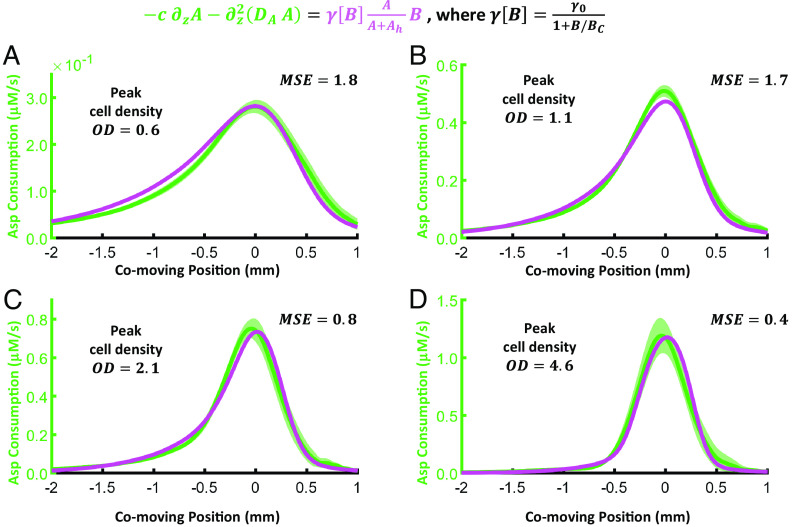
Fig. 3.
Asp dynamics are consistent with cell density–dependent consumption rate. Top: modified Asp consumption rate. Green: Asp consumption rate (LHS) calculated from the data. Magenta: Asp consumption rate (RHS) with parameters , and fit to match the LHS. The MSE between the LHS and RHS at the best-fit parameters is shown on each panel (see SI Appendix for details). These are shown for waves with peak bacterial cell density of (A), (B), (C), and (D). The parameters were fit to all data simultaneously. The shading represents the SD across replicates: for (A), for (B), for (C), and for (D). Uncertainties for the RHS of each equation are not shown for clarity but were included in the calculation of the MSE (SI Appendix).

